Chicago Class A Multifamily Market Update — Updated April 2024

Luxury Living consistently tracks leasing data on larger assets in Downtown Chicago’s Class A Market built after 2016. This dataset currently includes 78 properties and over 26,000 total units—and counting. These properties set the tone for the entire market. 

Tracking leased rentals as opposed to available units (asking rents) shows what is actually happening in Chicago multifamily. 

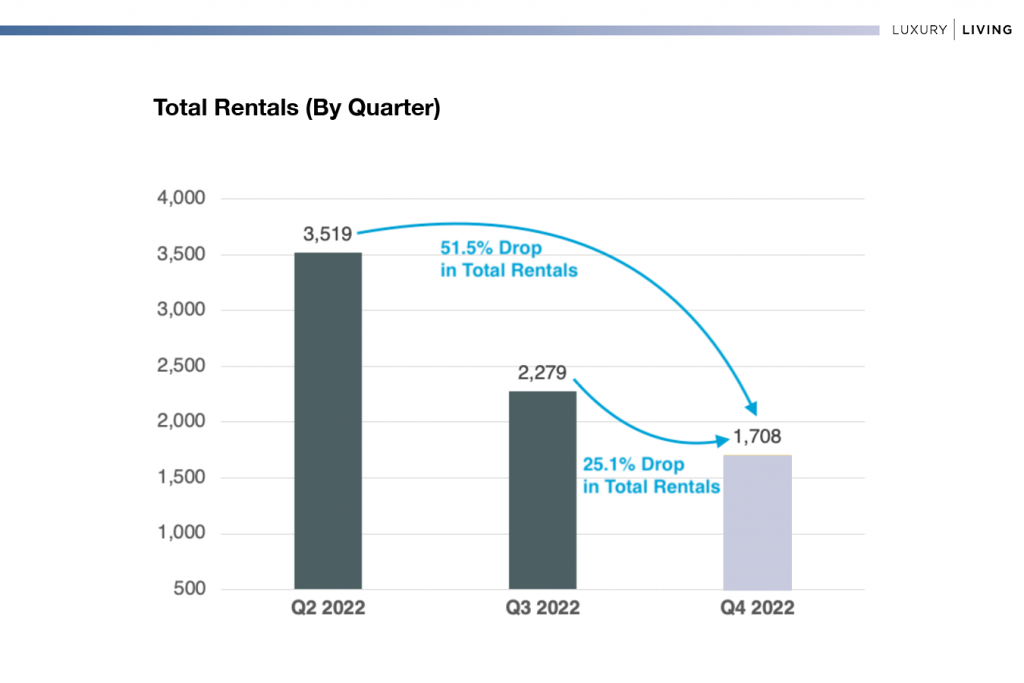
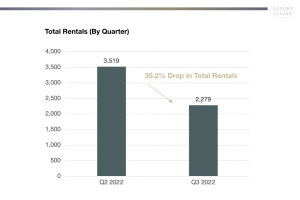
Solid Absorption in Q1 2024

The total rental volume increased by 15.2% in Q1 2024 compared to Q1 2023

While lease-ups commenced in Q1 2023, several were pre-leasing and had no occupancy in this quarter. Fast forward to 2024—those properties are continuing to lease, but an additional nine lease-ups are adding more volume at a faster pace. 

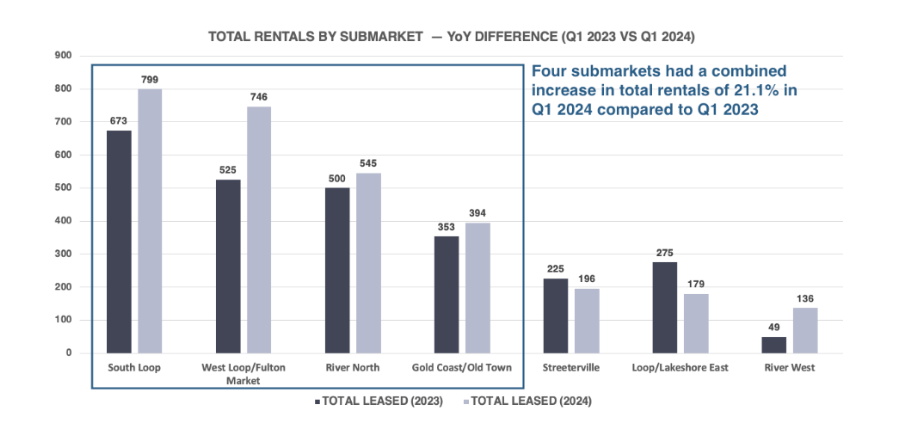
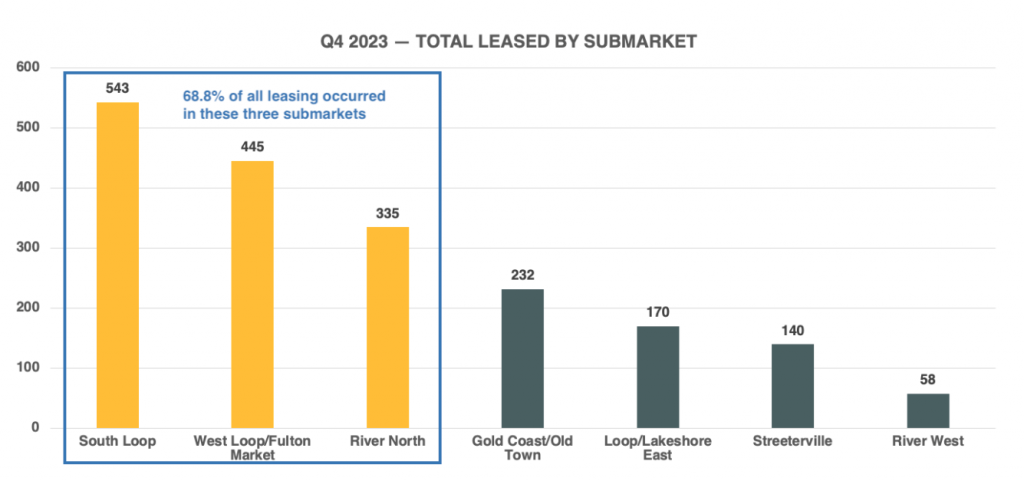
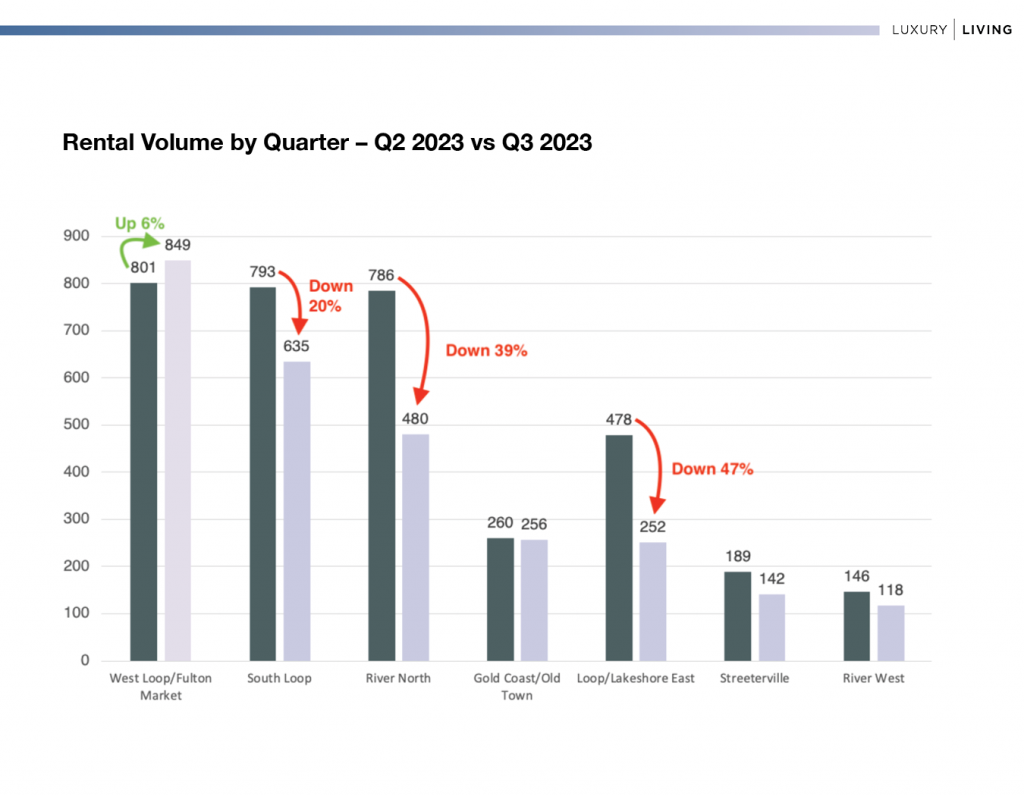
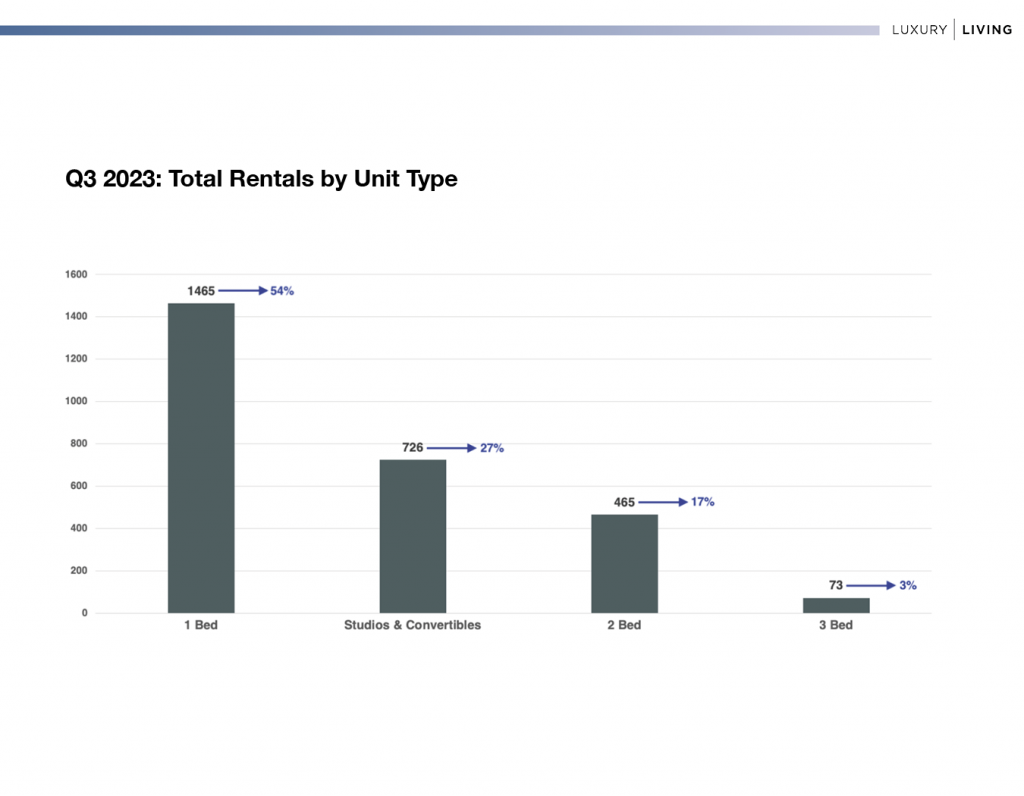
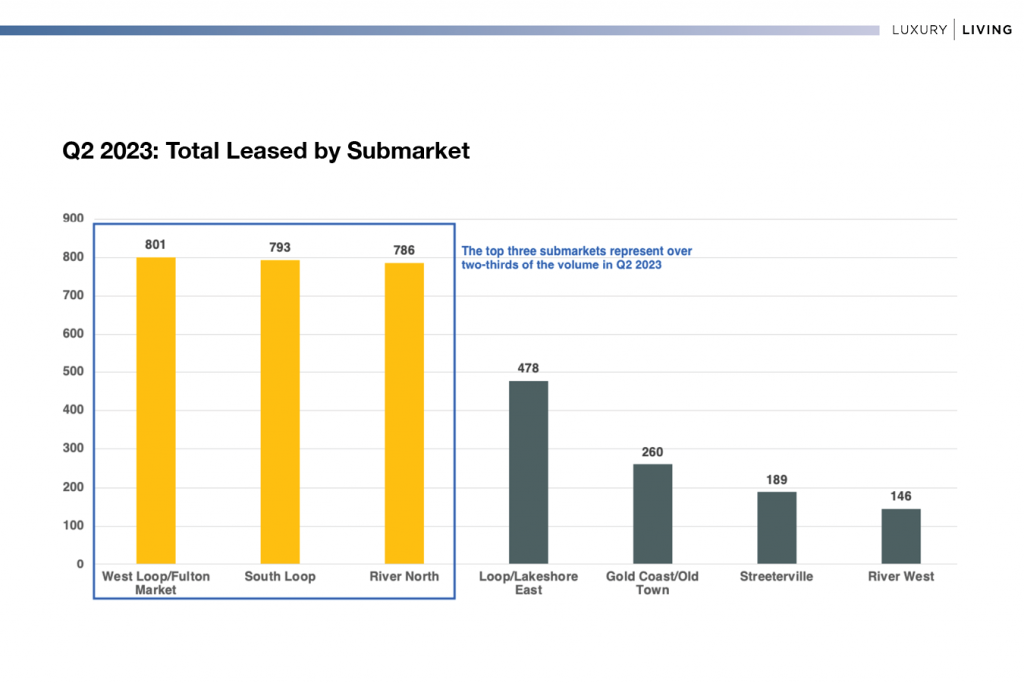
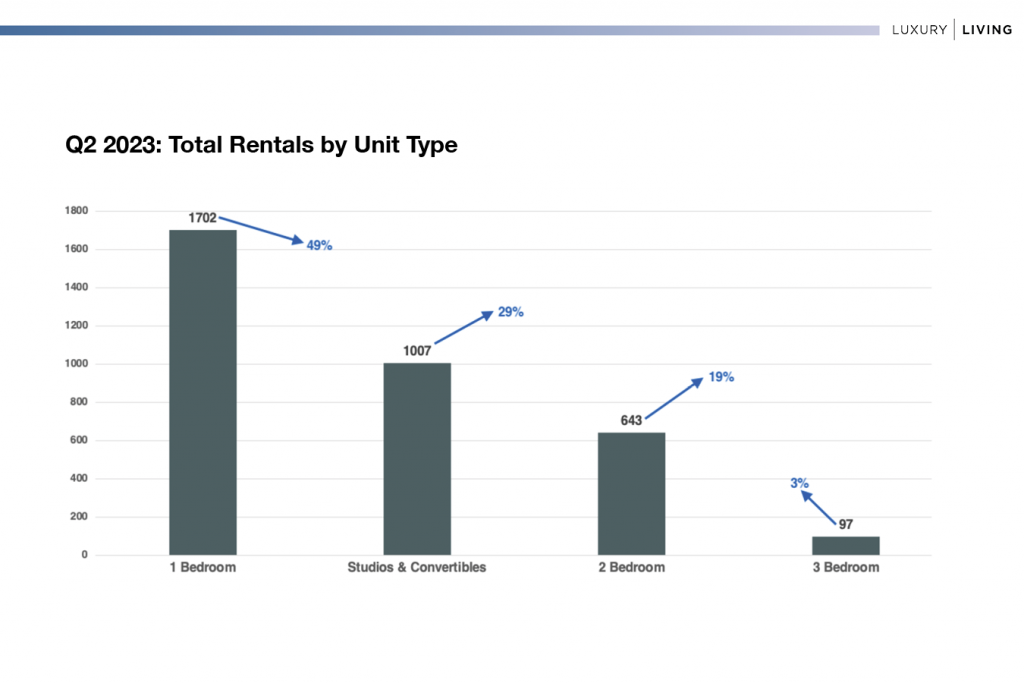
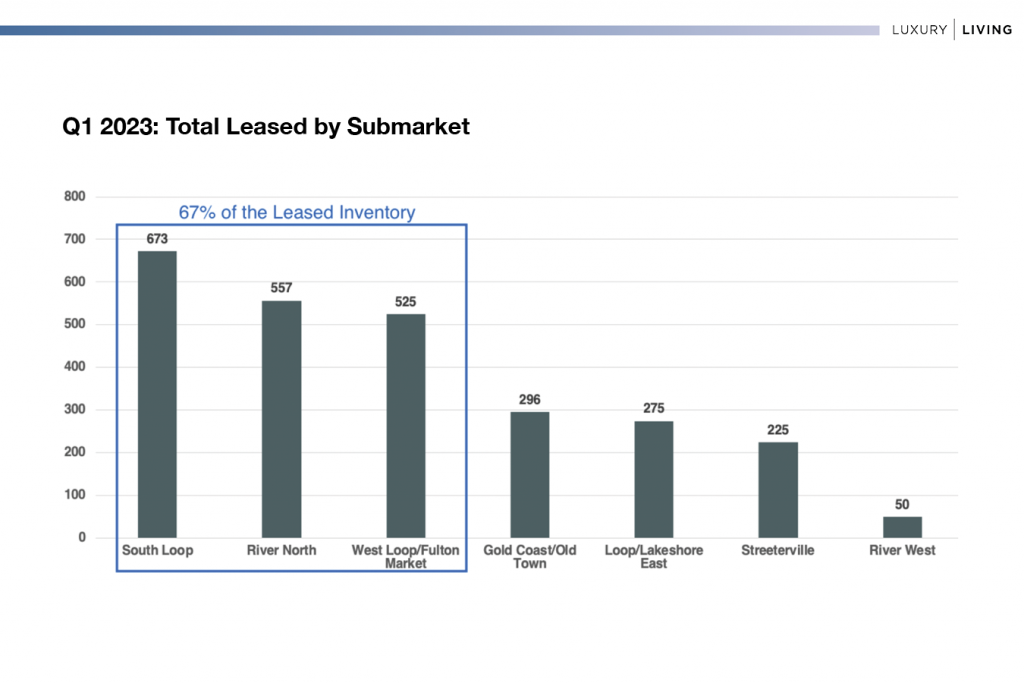
The big three—South Loop, West Loop/Fulton Market, and River North—accounted for nearly 70% of the total rentals. 

There were nearly 3,000 rentals in Q1 2024 compared to 2,600 in Q1 2023. This is a healthy jump when Q1 continues to feel the drag of seasonality. 

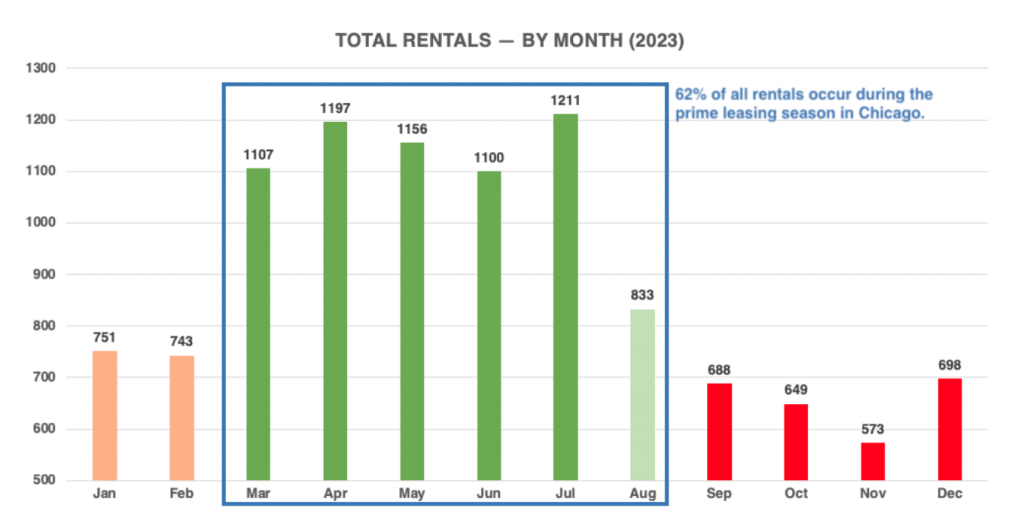
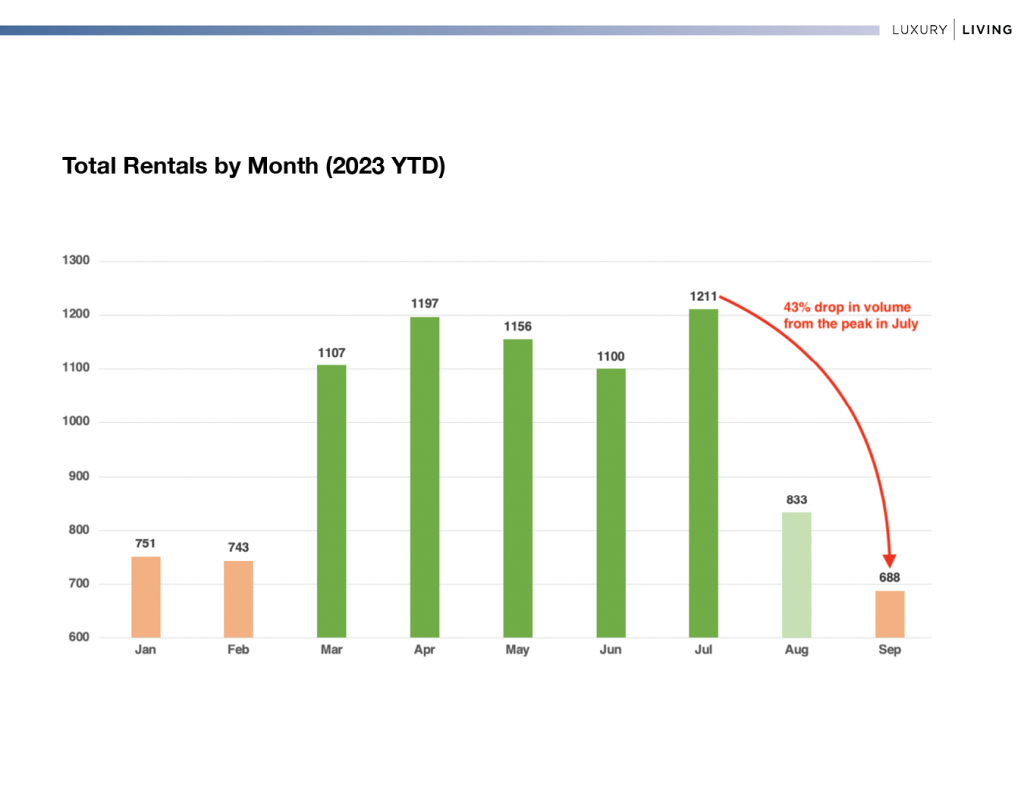
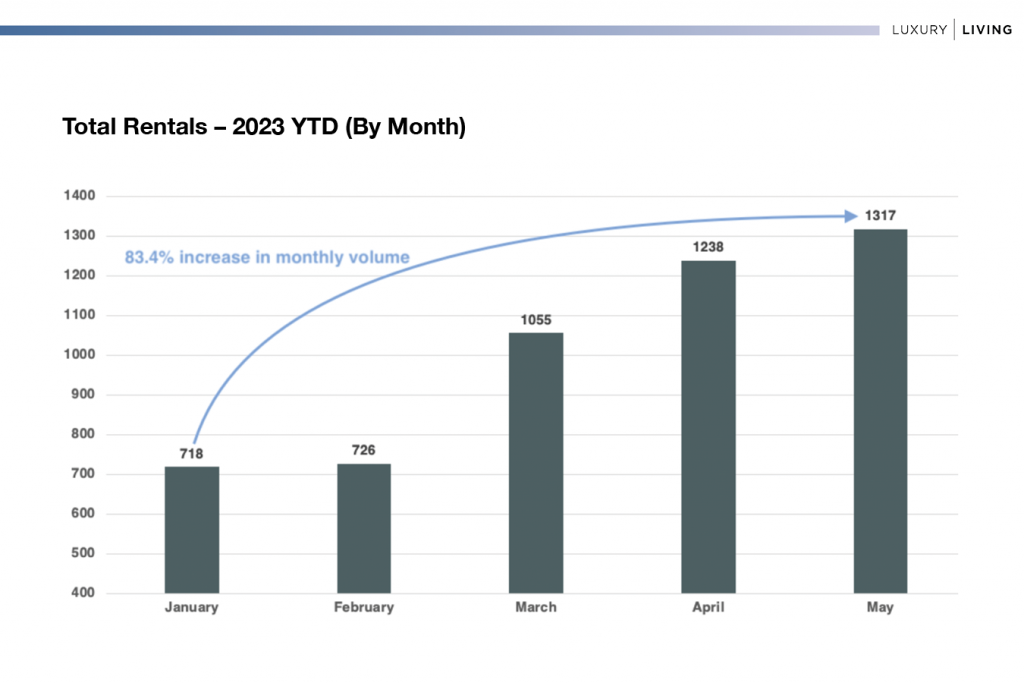
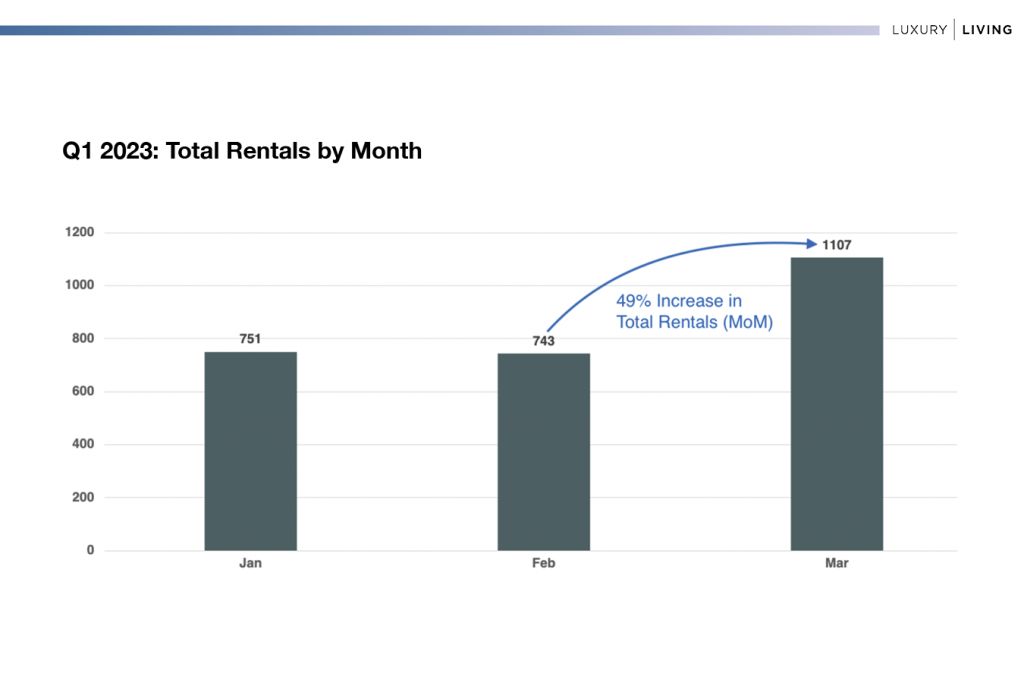
Speaking of seasonality, January and February are more associated with November and December, while March officially marks the beginning of what we call “Thrive Season.” This is the first of the busiest months of leasing in Chicago—March through August. 

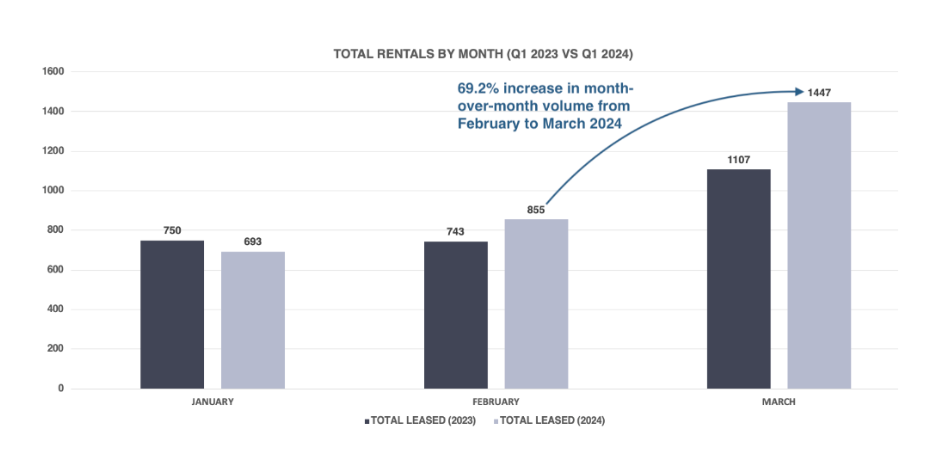
The total rental volume has increased substantially from February to March for both of the last two years. In 2023, the jump from February to March was a robust 49%, while the increase in 2024 for the same period was 69.2%. This is a huge difference YoY. 

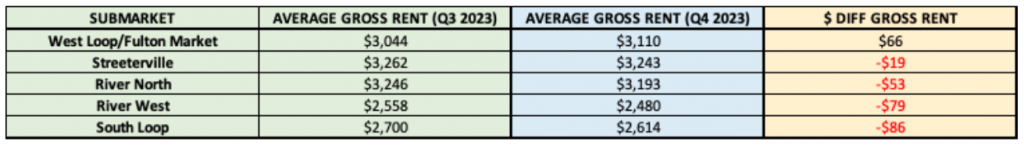
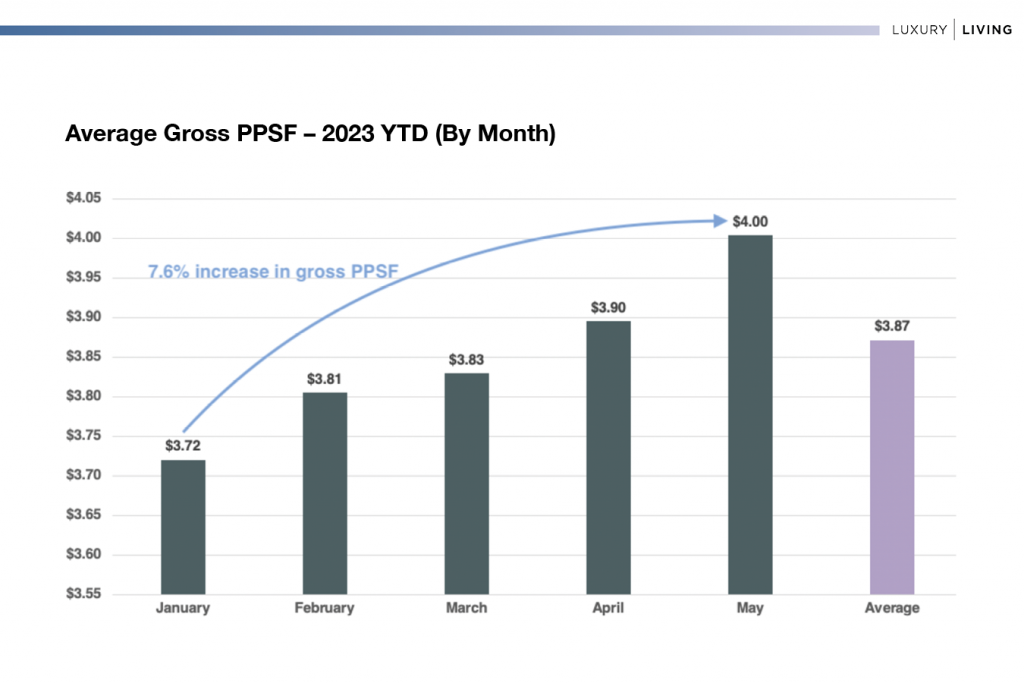
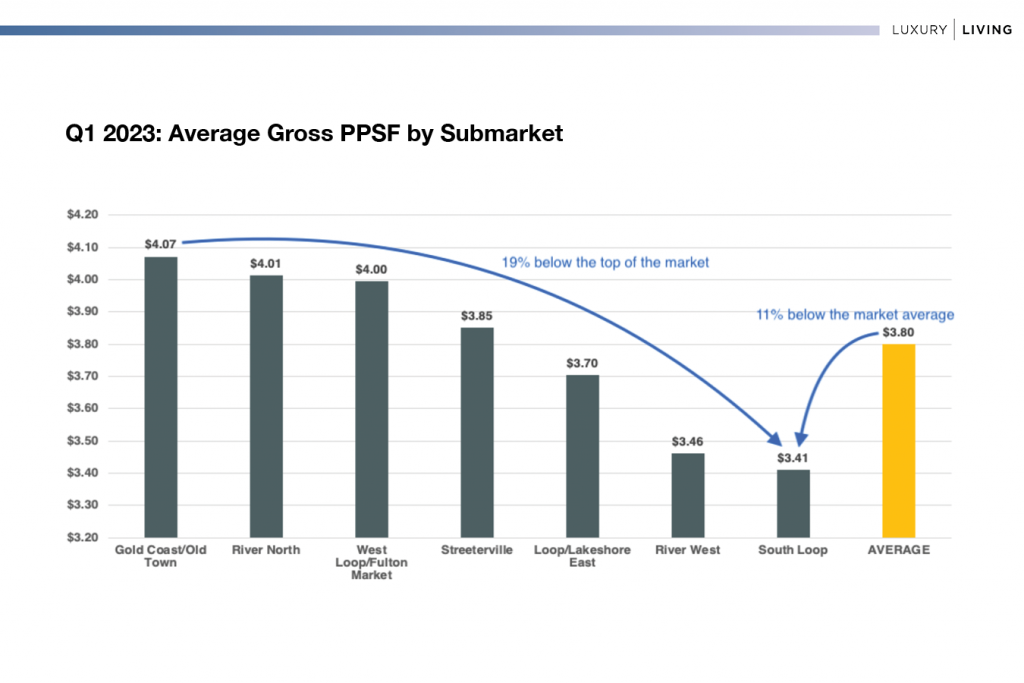
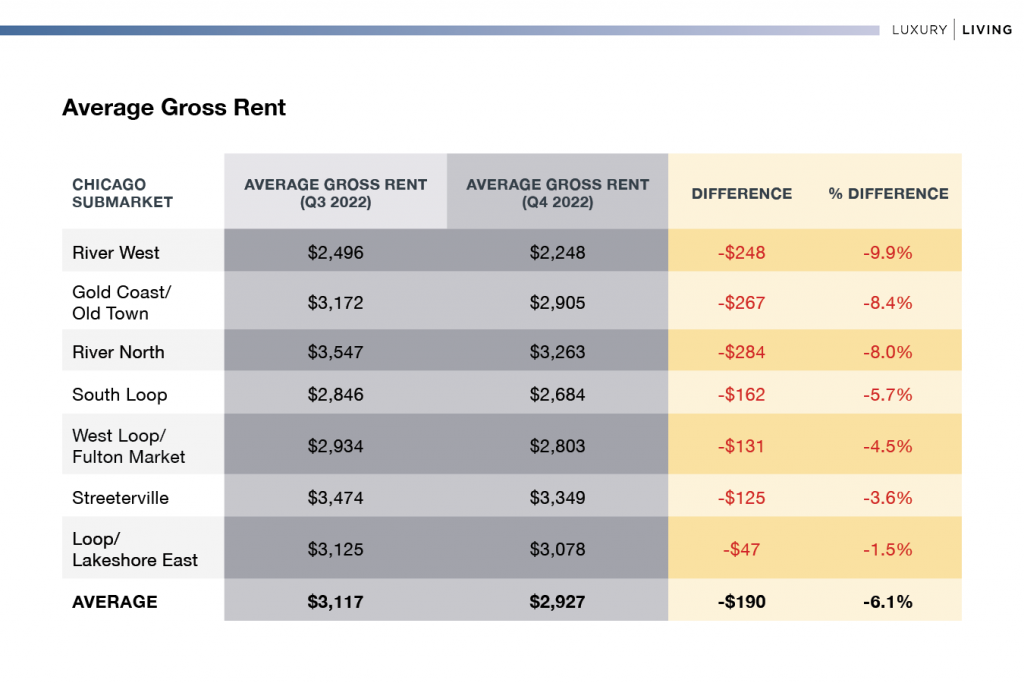
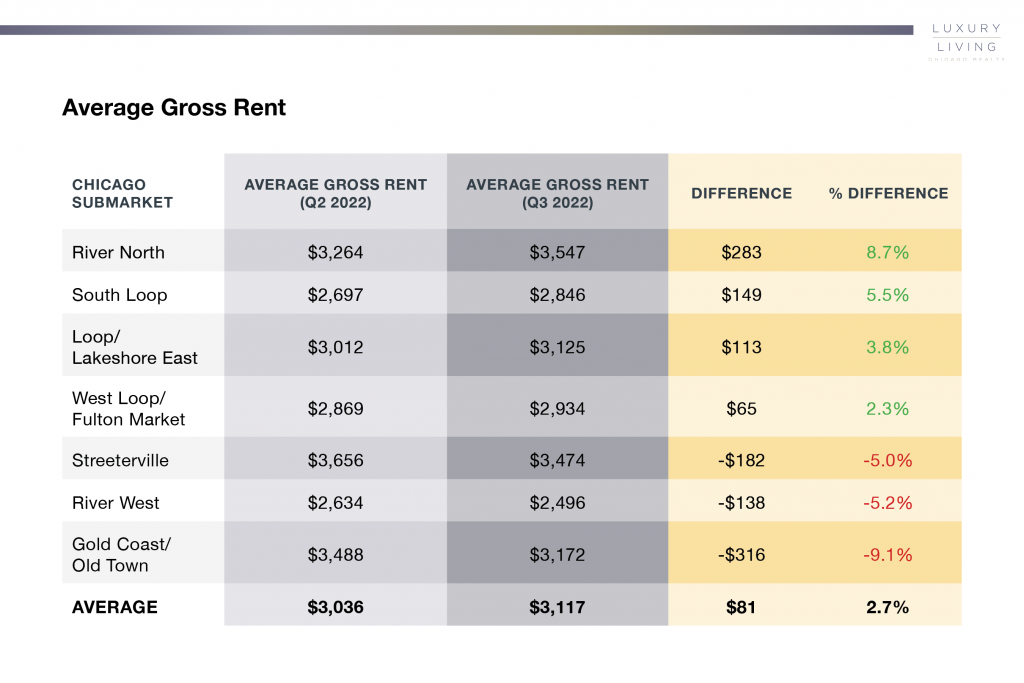
Average Gross Rent Ticks Up in Q1 2024

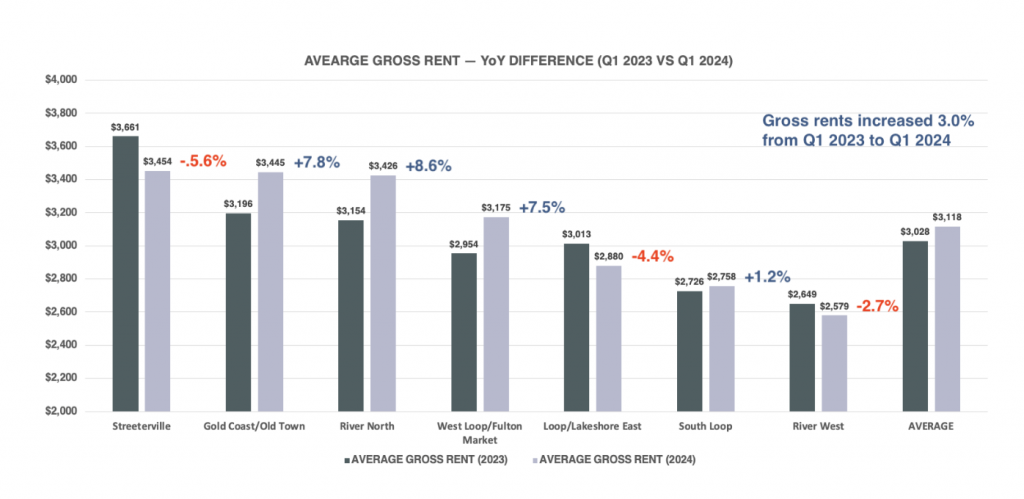
This group of properties saw a healthy overall increase in gross rent of 3.0% when compared to Q1 2023. However, growth is inconsistent from submarket to submarket for various reasons: 

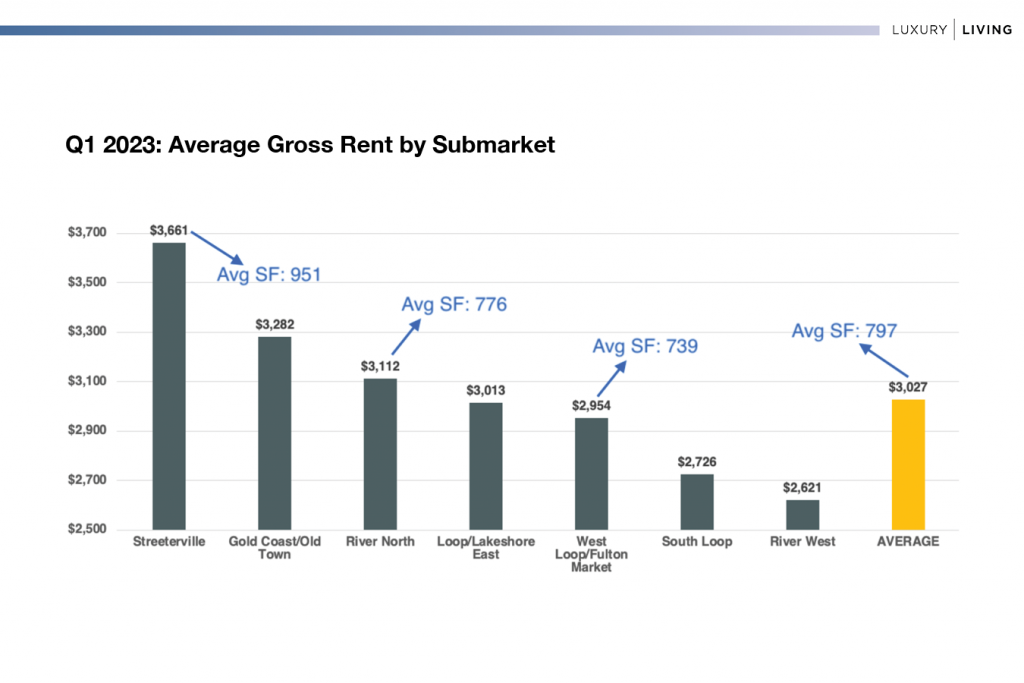
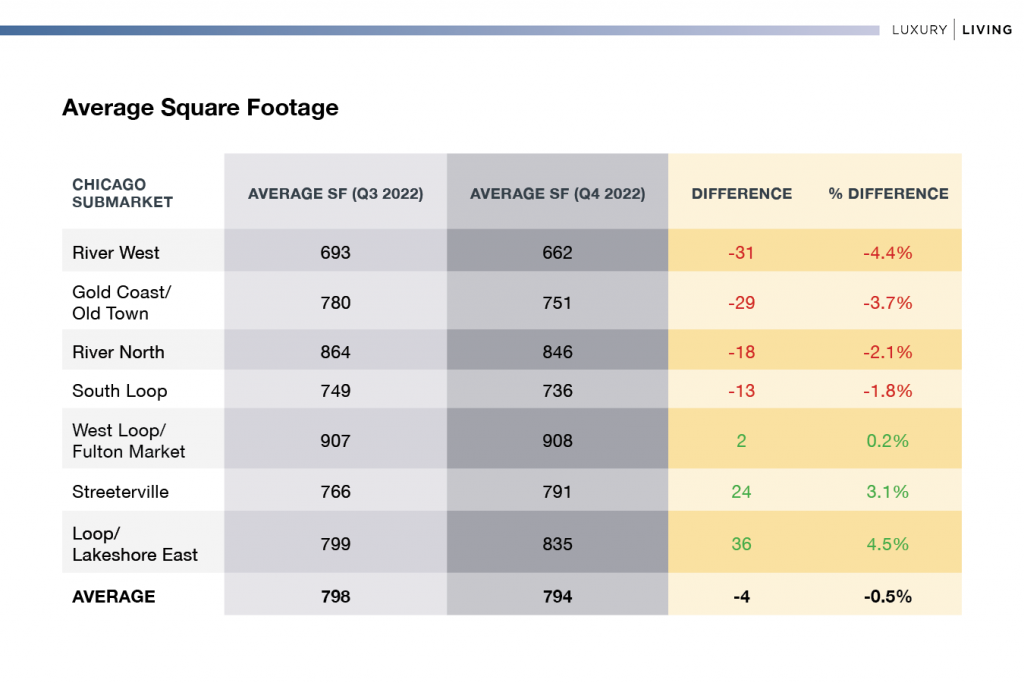
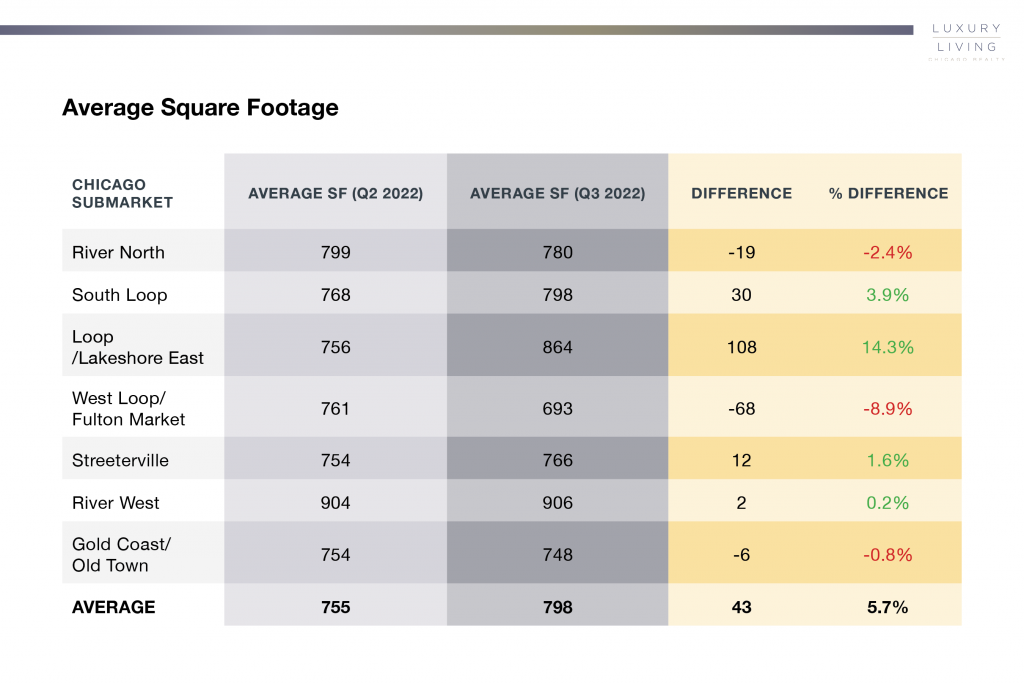
Streeterville shows a 5.6% decrease in gross rents. The primary driver for this is average SF, which is the one variable that will continue to impact year-over-year rent growth. The average SF for Streeterville in Q1 2023 was 951, while for the same period in 2024, it dropped to 882, a 7.8% decrease. Smaller average SF will lead to lower rents, but it’s nothing to be surprised about when you have context. 

The SF variance was a similar dynamic in River North, where the average SF in Q1 2023 was 769, while in Q1 2024 it rose to 833 (+8.3%). This is nearly identical to the average gross rent increase of 8.6%, but also contributed to a lower gross PPSF year-over-year due to the larger average SF. SF and PPSF have an inverse relationship; the larger the SF, the lower the PPSF. 

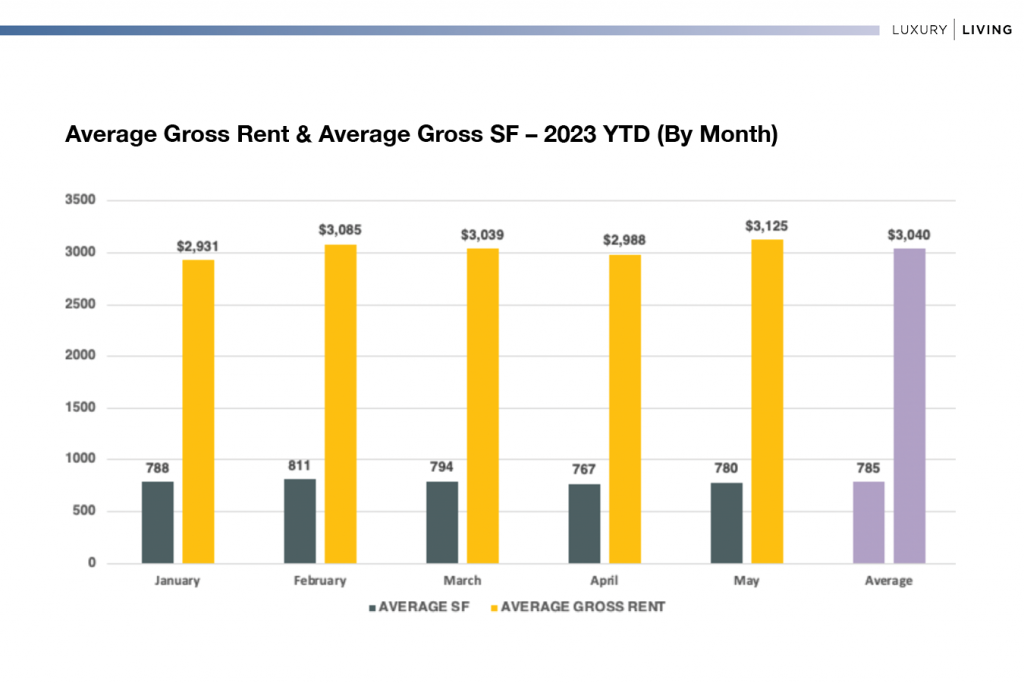
 Overall, the average gross rent increased from $3,028 to $3,118. This period marks the first time we have seen average rents across these properties higher than $3,100. 

The narrative of Chicago continuing to lead the nation in rent growth continues.

Digging Deeper

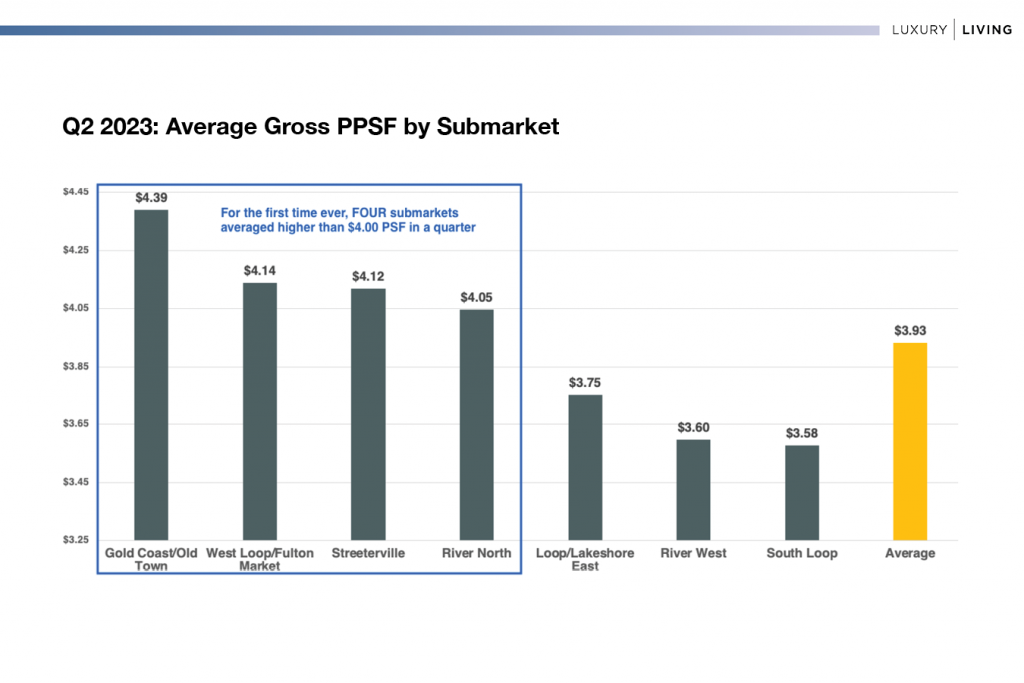
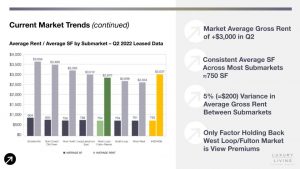
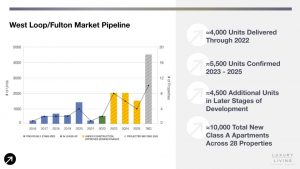
West Loop/Fulton Market continues to be the most active multifamily market in Chicago. In 2024, 22 properties are being tracked in the West Loop/Fulton Market, several of which are premier lease-ups. Even though the gross rent increased a sizable 7.5%, it still felt low considering the quality of the new deliveries and the high rents achieved in this submarket in 2023 and 2024. 

The influx of high-end inventory caused a ripple effect for the older, shorter, less-amenitized properties, which still needed to compete for renters. 

When only looking at assets delivered from 2016 – 2022, rents decreased for 10 of the 13 properties, and there was only a combined gross rent increase of 1.3%. 

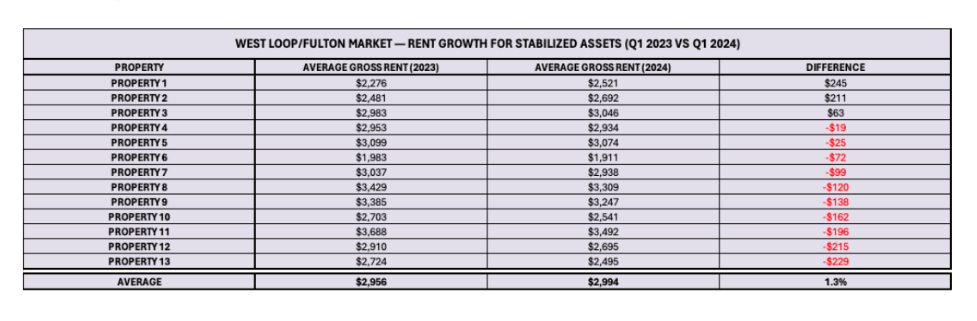
Furthermore, these properties comprised 65% and 57% of the rental volume in Q1 2023 and Q1 2024, respectively. These slightly older/shorter properties prevented the submarket’s rent growth from exceeding 10%. 

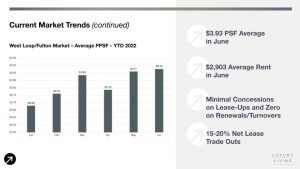
Here’s the most compelling data point: When only considering 2023 and 2024 West Loop/Fulton Market lease-ups, the average rent is $3,581, nearly $600 higher than the 13 properties in the above data set. 

Historically, the only thing holding gross rents back for West Loop/Fulton Market was building height and view premiums, which have always helped drive higher rents in submarkets like River North and Streeterville. As the newer properties grow taller, so do the rent premiums. When this was once a $2,800 submarket, the average rent in West Loop/Fulton Market is approaching $3,200, a 14% increase.

At Luxury Living, we not only provide data, but analyze the data to help inform developers and capital partners to make the best decisions on pricing strategy, unit mix, and amenity programming.


Click Here to Download our Q1 Chicago Class A Multifamily Market Update

The Saint Grand Welcomes First Residents

The Saint Grand, a co-development and joint venture between Mavrek Development, Double Eagle Development, Luxury Living, and GW Properties, began welcoming its first residents last month. The mixed-use development is located in the heart of Chicago’s Streeterville neighborhood. The Saint Grand includes 248 Class A luxury apartments at 218 E. Grand Ave, 45,000 square feet of offices at 535 N. St Clair, and 8,000 square feet of street-level retail at the corner of Grand Avenue and N. St. Clair.


“The Saint Grand’s apartments fuse vibrant Chicago living into sophisticated design, seamlessly integrated with the thriving Streeterville community,” said Aaron Galvin, Founder of Luxury Living. “After the first few weeks of leasing, we are thrilled by the initial traction.”


The Saint Grand’s apartments feature a mix of floorplans ranging from studios to 2 Bedrooms + Dens, emphasizing in-unit workspaces and private outdoor space to accommodate post-pandemic renter preferences. A suite of community amenities includes a state-of-the-art fitness center, co-working spaces with ten private study/work rooms, upscale lounges, and a rooftop pool deck scheduled to open in May.


“The Saint Grand offers highly requested amenities, including in-unit workspaces to accommodate work-from-home and private outdoor space,” said Galvin. Using real-time rental trends to inform this property’s architecture, design, and operations has been incredibly helpful. Initial feedback is proving our development thesis resonates with renters.”


In addition to the multifamily offering, the property includes The Offices at The Saint Grand, 45,000 square feet of flagship Class A office space located at 535 N. St Clair. The two full floors of office space also include private outdoor space, modern ventilation systems, and other intentional post-pandemic health safety elements. Office tenants will benefit from accessing and enjoying the apartment amenities.


“As one of the most active development groups in Chicago, we’re thrilled with the market’s reaction to The Saint Grand,” remarked Adam Friedberg, CEO at Mavrek. “In the coming weeks, we will be unveiling a lineup of exciting retail tenants poised to elevate the neighborhood’s vibrancy and enrich the experiences of both residents and office tenants.”


Double Eagle President Andrew Juiris added, “The Saint Grand is already exceeding expectations. We couldn’t be happier with the level of luxury and quality the property offers residents, shoppers, and employers.”


Along with the development team, The Saint Grand is the result of collaboration among industry leaders NORR (architecture), Lendlease (construction), Harken Interiors (interior design), and Cushman and Wakefield, who will oversee residential and commercial property management.


Learn more about the apartments at LiveSaintGrand.com.


Inquire about the Offices at The Saint Grand at WorkSaintGrand.com.


Chicago Class A Multifamily Market Update — Updated January 2024

Luxury Living consistently tracks leasing data on larger assets in Downtown Chicago’s Class A Market built after 2016. This dataset currently includes 72 properties and over 23,000 total units—and counting. These properties set the tone for the entire market. 

Tracking leased rentals as opposed to available units (asking rents) shows what is actually happening in Chicago multifamily. 

Seasonality Strikes Again

September marks the first full month of the seasonality dip, but Q4 is where property owners feel the most decrease. Fewer renters are looking for apartments during this time, and even with seasonably high concessions, the volume simply isn’t there. 

There were just over 1,900 rentals in Q4, which is a 40% decrease from Q3 (2,700 rentals). For even more context, there were nearly 3,500 rentals in Q2—nearly twice as many rentals as Q4. 

The above chart clearly illustrates why an optimized lease-expiration schedule is so important. An optimized expiration schedule not only maximizes revenue, but ensures the right inventory when renters are looking for apartments. 

South Loop Regains the Top Spot

In Q1 2023, South Loop had the top spot in total rentals, but since that time West Loop/Fulton Market shot to #1 in Q2 and Q3 due to the high number of lease-ups that launched this year. As the West Loop/Fulton Market buildings stabilized, South Loop returned to #1 on the list in Q4 2023. 

In 2024, there are lease-ups in ALL submarkets except River West and Loop/Lakeshore East. West Loop/Fulton Market will likely take the top spot again in Q2 and Q3 2024 with six lease-ups and 1,800 units delivering. 1000M, with 738 units in the South Loop, may have something to say about which submarket ends up number one in leasing volume in 2024.  

Lease-ups Take Away

No submarket had a bigger drop in quarter-over-quarter volume than West Loop/Fulton Market. There were five lease-ups in 2023, and most hit stabilization in Q4. The leasing frenzy in Q2 and Q3 came to an abrupt halt and saw a steep decline of 47% from Q3 to Q4. The next closest volume drops were in Loop/Lakeshore East (-32%) and River North (-30%). 

Technically, River West had the steepest decline (-51%), but it was only 3% of the volume for the quarter. 

Streeterville was nearly even at -1.5%, and Gold Coast/Old Town did not see a significant dip, only down 9.4%. 

Average Gross Rents vs. Net Rents

The Average Gross Rent for the market in Q4 was only $62 lower than Q3. How is that possible? Answer: Concessions. 

As the market starts to feel the burn of seasonality, the first reaction is to start offering concessions to help increase leads, traffic, and rentals. Then the comps start to also offer concessions, so more concessions are offered to stay ahead—eventually leading to 2 months of free rent, 6 months of free parking, waived admin fees, and a delicious fruit basket. 

Five of seven submarkets only showed an average gross rent difference of -$34 from Q3 to Q4. The average SF in Q4 was slightly higher at 790, while Q3 was 761 (+29), so average SF was not a major factor. 

West Loop/Fulton Market was slightly higher, which makes sense. Properties in lease-up generally never lower gross rents, but will add heavy concessions to help reach stabilization. In Q4, most of the West Loop/Fulton Market lease-ups offered 1 to 2 months free.  

For the remaining submarkets with mostly stabilized assets, revenue management software was adjusting rents down slightly to keep up with the market while also offering additional concessions. 

Concessions will start to disappear in Q1 for stabilized assets, while properties in lease-up will keep at least one month free to ensure higher velocity. Gross rents will remain steady in January and February, and we’ll start to see the first bump in rents in March as it kicks off the busy season in Chicago. 

The question is: How much growth can we expect to see in 2024 for this asset class? Chicago was among the strongest cities in the country in 2023, and we remain confident the growth trend will continue in 2024 and beyond

At Luxury Living, we not only provide data, but analyze the data to help inform developers and capital partners to make the best decisions on pricing strategy, unit mix, and amenity programming.


Click Here to Download our Q4 Chicago Class A Multifamily Market Update

Luxury Living Announces Leadership Succession 

Amy Galvin stepping into CEO role, Aaron Galvin focusing on business development and strategic growth.


Luxury Living — a vertically integrated multifamily leasing company based in downtown Chicago — announces Co-Founder Amy Galvin will step into the CEO role. Formerly the company’s Chief Culture Officer, Amy will replace Founder Aaron Galvin, as he transitions away from CEO leadership to focus on the company’s business development and strategic growth. 


As Chicago’s leading third-party multifamily leasing company, Luxury Living has executed 60+ exclusive leasing assignments for Chicago’s most prominent developers and capital partners. As the company transitions to a more strategic focus, the next era of Luxury Living involves a return to its origins — concentrating on downtown Chicago lease-ups — and a future emphasis on multifamily ownership.


“Taking the helm, my unwavering focus lies in enhancing operational efficiency, securing and retaining top-tier talent, and forging strategic partnerships,” said incoming CEO Amy Galvin. “Our mission is crystal clear — to deliver an unparalleled, best-in-class experience to our clients: renters, real estate developers, and capital partners.”


In her first year as CEO, Galvin’s strategy will be to refine Luxury Living’s product offerings and processes, re-establish an executive leadership team, and expand the organizational ecosystem to support the company’s future growth.  


With a sole, intentional focus on Chicago, she said Luxury Living intends to use the city’s vast network of talent and sophisticated business community to foster connections and relationships and provide the best renter experience.


Also part of the company’s new strategic focus is multifamily ownership and development, an aim that began last year when Luxury Living announced its first joint venture development — The Saint Grand. The 21-story, mixed-use property features 248 Class A luxury apartments, 40,000 square feet of office space, and 8,000 square feet of premium retail in the heart of Streeterville. Pre-leasing for The Saint Grand’s apartments is set to begin in Q1 2024.


“The Saint Grand is our first foray into multifamily development and confirmed our thesis that development will be a meaningful part of Luxury Living’s continued growth,” said Founder Aaron Galvin. “Stepping forward into a new and exciting role allows me to focus on finding more acquisition and development opportunities in tandem with providing consulting and best-in-class leasing services for Chicago multifamily developers and investors.”


In addition to The Saint Grand, Luxury Living’s third-party lease-up assignments for 2024 thus far include:

  • The Dylan, a 282-unit Class A apartment development by Sterling Bay and Ascentris in Fulton Market
  • The Leo, a 168-unit Class A apartment development by Vista Property in River North
  • Maeve on Lake, an 82-unit Class A apartment development by Maeve Group in Oak Park, Illinois
  • Maeve on Ashland, an 89-unit Class A apartment development by Maeve Group in West Loop
  • District 1860, a 299-unit Class A apartment development by Tucker Development in Lincolnwood, Illinois


Over the last 12 months, Chicago has led the nation in Class A apartment market rent growth,” said Aaron Galvin. “With new development supply consistently meeting market demand, Chicago rarely has huge swings up or down, which makes multifamily investment attractive for strategic real estate investors. Over my 20-year career, I have never seen a better opportunity to support Chicago as a multifamily consultant, developer, and participating operating partner.” 


Since co-founding Luxury Living in 2007, Amy and Aaron Galvin have focused intently on measured growth — leading to the leasing and renewal of 27,000 apartments, $200 million in for-sale condos and homes, and the generation of $10 billion in value for multifamily developers and owners. Luxury Living is a repeat Inc 5000 fastest-growing company in America, making the list six times.


Slated for completion in early 2024, the leadership transition will ensure the seamless continuation of Luxury Living’s commitment to enhance renter and real estate developer experiences while providing innovation, excellence, and a renewed focus on downtown Chicago.

Chicago Class A Multifamily Market Update — Updated October 2023

Luxury Living consistently tracks leasing data on larger assets in Downtown Chicago’s Class A Market built after 2016. This dataset currently includes 70 properties and over 23,000 total units—and counting. These properties set the tone for the entire market. 

Tracking leased rentals as opposed to available units (asking rents) shows what is actually happening in Chicago multifamily.


The Power of Lease-Ups

When comparing the total rentals by submarket in Q2 2023 to Q3 2023, it’s inevitable to see a drop-off. Q2 is historically the highest-volume quarter of the year.

But, when there is a submarket with five lease-ups like there was in West Loop/Fulton Market, let’s just say that has some serious pull.

The average of all submarkets combined for a drop in leasing volume of 21%, while West Loop/Fulton Market held strong, and was UP 6% over the previous quarter. 

This is what happens when five lease-ups are simultaneously duking it out for renters heading into the slowest part of the leasing season—the dreaded September + Q4. 

Concessions were a major factor for these lease-ups, and it shows how impactful they were compared to the six other submarkets.

In Q2 2023, lease-ups contributed 31.8% of the total rentals in the West Loop/Fulton Market submarket. In Q3 2023, this number jumped to 42.5% of all leasing volume in West Loop/Fulton Market.  

With eight lease-ups launching in Q4 2023 through 2024—2,000 more units—it’s more than likely this trend will continue.


The Slow Season Cometh

Luxury Living has always defined the “busy season” in Chicago as March through July…and half of August. These months are when the vast majority of leasing occurs throughout the year. 2023 was no different.

March through July is really the peak, where 66% of the total rentals occurred during these 5 months. The drop-off in September is always expected. But, just like temperatures falling from mid-70s to low-40s, we’re always somehow shocked when it happens.

The market will hover in the 500 to 800 range until March of next year. No matter what revenue management software attempts to do, there just aren’t enough renters looking for apartments in September through February to make a dent.


What are People Renting?

One of the most important data points in Chicago multifamily is tracking leasing trends by unit type. There are so many factors that play into this, whether it’s single renters or couples leasing more units, a rise in relocations to Chicago, rents spiking, which impacts affordability and qualifications, to a myriad of other economic factors.

As rents rise during peak leasing season in Chicago, renters will have to choose between a larger apartment in an older building, perhaps sacrificing location, or a smaller apartment in a new property, in their desired location. Budgets and wish lists can be like oil and water. 

Comparing Q2 to Q3 2023, 1 bedroom apartments had the largest change in market share, rising from 49% to 54%. 1 bedrooms are generally in the 45% to 50% range, so to see this unit type above 50% is above average.

The average 1 bedroom gross rent in Q3 was $2,754 (Average SF: 716 / Average PPSF: $3.85). Of the 1,465 1 bedroom rentals in Q3, 694 had a square footage of 716 or lower (47.4%), while 771 had a square footage larger than 716 (52.6%). 

As rents increase around the city, studios and convertible rentals have been on the rise over the last few years due to affordability. 

The average studio/convertible gross rent in Q3 was $2,177 (Average SF: 525 / Average PPSF: $4.15). Renters paid an average of $576 more (+27%) to live in a 1 bedroom that’s 191 SF larger (+36%). 

While the average gross rents for 1 bedrooms remained consistent in Q3, staying within the range of $2,718 to $2,772, the studios/convertibles saw the biggest drop from July to September.

There was only a 1% drop in gross rents from July to August, but a 6% drop in gross rents from July to September. The square footage was still very close—519 vs. 530—which makes the drop in gross PPSF from $4.26 PSF down to $3.95 PSF even more impactful. 

This is why Q3 can be so misleading. July and half of August are generally solid leasing months in Chicago, but September is a bit of a wet blanket, always ruining the party. 

As seasonality causes havoc in the market, it’s critical to understand why this is happening, and how to prepare for it. Whether that is staying ahead of the market with concessions, or optimizing a lease-expiration schedule, there is always a way to stay ahead when you know what’s coming. 

At Luxury Living, we not only provide data, but analyze the data to help inform developers and capital partners to make the best decisions on pricing strategy, unit mix, and amenity programming.


Click Here to Download our Q3 Chicago Class A Multifamily Market Update

Chicago Class A Multifamily Market Update — Updated July 2023

Luxury Living consistently tracks leasing data on larger assets in Downtown Chicago’s Class A Market built after 2016. This dataset currently includes 68 properties and just over 22,000 total units—and counting. These properties set the tone for the entire market. 

Tracking leased rentals as opposed to available units (asking rents) shows what is actually happening in Chicago multifamily.


The Big Three

Consistent with Q1 2023, the top three submarkets—West Loop/Fulton Market, South Loop and River North—had 69% of the total rentals in Q2 2023.

The biggest difference in Q2 2023 is West Loop/Fulton Market taking the #1 spot over South Loop. In Q1 2023, South Loop had 20% more rentals than River North, and 28% more rentals than West Loop/Fulton Market. This is quite a shift.

West Loop/Fulton Market is getting stronger by the day. Lease-ups in this submarket contributed 31.8% of the total rentals this quarter.


A Record-Breaking Quarter

While Gold Coast/Old Town didn’t have quite the volume, it far-surpassed its competitors on a gross PPSF basis, achieving an astounding $4.39 PSF in Q2 2023. That is 6.1% higher than the second-highest achieved PPSF in the market at $4.14. It’s also 11.6% higher than the market average.

This marks the first time four submarkets surpassed $4.00 PSF on achieved rentals in a single quarter. 

There is still substantial disparity for South Loop, but gross PPSF did rise 5% from a low of $3.41 in Q1 2023

What’s more, when South Loop is removed from the set, the average for the market rises to $4.04 PSF.


What are People Renting?

One of the most important data points in Chicago multifamily is tracking leasing trends by unit type. There are so many factors that play into this, whether it’s single renters or couples leasing more units, a rise in relocations to Chicago, rents spiking, which impacts affordability and qualifications, to a slew of other economic factors.

Historically speaking, 1 bedroom rentals equate to 45–50% of the total in Chicago, while studios & convertibles usually range closer to 20–25%. The shift in the market over the last few years is 2 bedrooms are starting to fall below 20% of the total rentals in the market

Why is this happening?

The average rent for a 2 bedroom in Q2 2023 was just under $4,300, which is the exact same average gross rent in Q2 2022.

To qualify for the average 2 bedroom, based on income of 3x the monthly rent, an individual would need to make $155,000 per year. Yes, couples often lease 2 bedrooms and have dual income, but the idea is to attempt to save money—the average rent compared to the average qualifying income is 33.1%. 

32% of the 2 bedrooms leased in Q2 had a gross rent $4,500 or higher. The average for this group of units was $5,212, and to qualify would require an individual income of $188,000. 

1 bedrooms, which consisted of 49% of the total rentals in Q2 2023, had an average gross rent of $2,825 and an average SF of 723. The smaller SF is a trend that is consistent, but that also means these units are less likely to be leased by couples. To qualify for the average 1 bedroom, an individual would need to make $102,000 per year. 

As rents continue to rise, Chicago multifamily needs to continually consider demographics to ensure the inventory in the pipeline not only meets renter demand, but affordability does not impact absorption. 

At Luxury Living, we not only provide data, but analyze the data to help inform developers and capital partners to make the best decisions on pricing strategy, unit mix, and amenity programming.


Click Here to Download our Q2 Chicago Class A Multifamily Market Update

Chicago Multifamily – The Road Ahead

Luxury Living consistently tracks leasing and availability data on larger multifamily assets in Downtown Chicago’s Class A Market built after 2016. This dataset currently includes 68 properties and just over 22,000 total units. 

Tracking leased rentals instead of available units (asking rents) shows what is really happening in Chicago multifamily. 

The following data covers leasing data from January 1, 2023 through May 31, 2023


Gross Chicago Rentals — By Month

In the first five months of the year, 5,054 units have been leased in this segmented market. This chart below matches expected Chicago seasonality, where January and February are two of the lower-leasing volume months and the market starts to pick up in March. 

There is an 83.4% increase in monthly volume when comparing January to May.

Total Rentals 2023 YTD By Month

While January and February saw very similar leasing volume, it’s been a consistent climb each subsequent month this year. 


2023 Peak Rental Season

While month-over-month data shows consistent increases, week–over-week data illustrated in the chart below shows leasing volume likely peaked in mid-April.

Total Units Leased 2023 YTD By Week

Leasing volume is always about when renters are looking for an apartment, not when they are moving in. Renters in April and May are looking to move 45–75 days in advance. There is a big difference between peak leasing season and peak move-in season.


How does leasing volume impact gross rents?

The answer: Not much.

Average Gross Rent & Average Gross SF 2023 YTD By Month

So far, the average gross rent in 2023 is $3,040. 

The biggest gap in rent from the average is January (-$109), and the biggest gap from the peak ($3,125) compared to January is $194 (-6.6%). The overall trend is showing the gross rents this year have minimal variance, which indicates a stable market. 

High occupancy and above-average retention is the most likely reason for this consistency. Often we see average square footage (SF) variance but each month has been relatively consistent.   

There is more to learn when viewing this by gross PPSF.


Average Gross PPSF 2023 YTD By Month

Despite the steady decline in weekly rentals, the gross rents and gross PPSF in May were extremely strong, achieving an average of $4.00 PSF with just over 1,300 rentals. 

Not only did May surpass April by $137 in gross rent, but the average gross PPSF was also 2.8% higher, despite an average increase of 13 SF. 


Chicago Rent Prices in 2023

As occupancy remains high, gross rents will continue to increase slightly through the end of the summer. In 2022, we saw weekly volatility starting in June, but average gross rents didn’t really see a consistent dip until the end of September. 

Rents are likely to remain in the $3,000+ range for the next 3-4 months, and gross PPSF is also likely to remain high as well ($4.00+ PSF). 

The one data point to track is going to be weekly leasing volume. We’ll see some impressive rents, but it will be based on fewer and fewer rentals until the Bears play the Chiefs on September 24. 

Pro Tip: July 4th Week is going to be weird. It falls on a Tuesday, so the volume that week is going to be low. No need to overreact, it will bounce back the following week.


Disclaimer:
The material in this report is protected by copyright and cannot be reproduced without the express written permission of Luxury Living Real Estate Data compiled in this report is collected from several resources and analyzed by Luxury Living Real Estate and is provided to accurately communicate the status of this comp set to the best of our abilities.

Chicago Class A Multifamily Market Update — Updated April 2023

Luxury Living consistently tracks leasing data on larger assets in Downtown Chicago’s Class A Market built after 2016. This dataset currently includes ≈70 properties and just over 22,000 total units. These properties set the tone for the entire market. 

Tracking leased rentals as opposed to available units (asking rents) shows what is actually happening in Chicago multifamily. Furthermore, showing how the average gross rents compare to the average SF is equally important, as PPSF has a major impact on how a property is perceived in the market.


Q1 2023: The March Leap

January, February, and March include two of the slowest months of the year (January and February), along with one of the busiest (March), which makes Q1 appear to be stronger than it is. The key is to break down the data by month to understand the trajectory.

There is a 49% increase in total rentals from February to March which signals the kick-off to Chicago’s busy season. And also why comparing Q4 2022 to Q1 2023 doesn’t really tell much of a story. January and February are similar to Q4 while March is much closer to Q2 in velocity.


Volume Control

Of the seven prime downtown submarkets, two-thirds of the volume occurs in three of them: South Loop, River North, and West Loop/Fulton Market. West Loop/Fulton Market has three lease-ups that contributed 176 rentals to the total in Q1, which is 33% of these three neighborhoods’ total absorption. 

Look for West Loop/Fulton Market to take the second spot on this list for Q2 now that all three properties are no longer in pre-leasing environments.


Digging Deeper

 Average Square Footage

Reporting average gross rent without context can be misleading. One would think that Streeterville had a substantially better Q1 than River North, but when the average SF is 175 lower (-23%), it shows the smaller unit types dominated River North vs. larger unit types in Streeterville. 

Percentage of Studio – 1 Bedroom Rentals:

  • River North: 80%
  • Streeterville: 63%

The 175 SF difference between River North and Streeterville equates to $549 per month. Without the context of average SF, this data could be quite misunderstood.


South Loop: Ceiling or Floor?

Despite the high-end, amenity-driven properties built in the South Loop since 2016, this submarket continues to remain flat.

In Q1 2022, the South Loop was at $3.36 PSF. A full year later, this submarket has only increased $0.05 PSF (+1.5%). By contrast, West Loop/Fulton Market rose from $3.77 to $4.00 PSF (+6.1%) over the same period of time. 

South Loop had the highest volume of rentals in the market (26%), but the lowest PPSF

On a gross rent basis, South Loop is more in line with River West than West Loop/Fulton Market, despite significantly taller buildings with more view premiums. 


How much is this impacting the market? 

When South Loop is removed from the data set, the average PPSF for the market jumps from $3.80 to $3.94 (+3.7%)

This is significant information as investors look at Chicago as a whole. 


Loop/Lakeshore East: Missing the Middle?

Loop/Lakeshore East has four properties performing extremely well, averaging $4.05 PSF. The remaining properties, however, average $3.08 PSF—a difference of 31.2%

This isn’t being skewed by Average SF either. The bottom 3 properties average 791 SF while the top 4 average 846 SF (+55 SF).

This submarket shows the high-end can perform, especially properties closer to the lake and Michigan Avenue. Proving the point, it’s all about where you build, not what you build. 

This gap also opens the opportunity for the $3.50 PSF option which leads to more momentum for office-to-residential conversion. 

At Luxury Living, we not only provide data, but analyze the data to help inform developers and capital partners to make the best decisions on pricing strategy, unit mix, and amenity programming.


Click Here to Download our Q1 Chicago Class A Multifamily Market Update

Chicago Class A Multifamily Market Update — Updated January 2023

Luxury Living consistently tracks leasing data on larger assets in Downtown Chicago’s Class A Market built after 2016. This dataset currently includes ≈60 properties and just over 22,000 total units. These properties set the tone for the entire market. 

Tracking leased rentals as opposed to available units (asking rents) shows what is actually happening in Chicago multifamily. Furthermore, showing how the average gross rents compare to the average SF is equally important, as PPSF has a major impact on how a property is perceived in the market.


Q4 2022: Seasonality Impact

As expected, lease volume in Q4 decreased significantly from ≈2300 leases in Q3 to ≈1700 leases.


Despite the 25% reduction in total rentals from Q3 to Q4, this was 10% less of a reduction as compared to the decrease from Q2 to Q3, where the volume of rentals decreased 35% quarter over quarter.  In the last two quarters, the amount of leases has dropped a combined 60%. In other words, the amount of volume in Q2 (the most active time of the year) compared to Q3 and Q4 is substantial.

Seasonality impacts Chicago apartment velocity as much as any city in the country.


Q3 vs. Q4 — Rental Data

Considering the reduction in total rentals, average gross rents only decreased by 6.1%. Historically speaking, this is less of a decrease than we typically see in Q4. 

Higher gross rents were able to be achieved because of higher occupancy. The average occupancy for this dataset was ≈94%. This allowed leasing/management teams to limit significant reductions in rent while maintaining occupancy. Minimal new deliveries in 2022 helped boost occupancy on stabilized properties. This trend should continue in Q1–2023. 

Average gross rents decreased in all seven downtown submarkets in Q4. The below table shows the variance in average gross rent from Q3 to Q4 by neighborhood submarket.

 Average Gross Rent

  • River West saw the biggest decrease in gross rent, dropping $248 (-9.9%).
  • Loop/Lakeshore East had a very minimal decrease of only $47 (-1.5%).
  • Four downtown submarkets saw gross rent decreases of 8.0% or more.


Digging Deeper

 Average Square Footage

The average SF in Q4 remained very consistent compared to Q3. The largest decrease in average SF was River West (-31 SF) and the largest increase was Loop/Lakeshore East (+36 SF). Square footage variance compared to Q3 was immaterial. 

Overall, the average SF was only down 4 SF (-0.5%).


Q4 = More Square Footage for Better Value

While the average SF did not vary from Q3, renters were able to get more bang for their buck in Q4 in select submarkets. 

The South Loop is a prime example. Renters were able to lease an apartment that was 24 SF larger while paying $162 less in rent. 

West Loop/Fulton Market renters leased nearly identical inventory (-13 SF) at a $131 discount (-4.5%). 

This is purely a factor of seasonality in Chicago, and why optimizing the lease-expiration schedule is one of the most important aspects of managing a Chicago Class A multifamily property. 

One Bedrooms Continue to Dominate

One-bedroom rentals have remained steady over the years, generally making up 45 to 50% of all rentals annually. Q4 was no different:

Studios/efficiencies continue to increase in demand, making up 27.3% of the total rentals in Q4. As gross rents continue to increase, this unit type will be more in demand based on income qualification

A single renter would need to make $24,747 more per year to qualify for the average 1 bedroom ($2,739) compared to the average studio/convertible ($2,051). 

At Luxury Living, we not only provide data, but analyze the data to help inform developers and capital partners to make the best decisions on pricing strategy, unit mix, and amenity programming.


Click Here to Download our Q4 Chicago Class A Multifamily Market Update

Luxury Living Celebrates 15 Years Of Real Estate Success

Marks 15th anniversary by updating company branding to reflect evolution

Over the last 15 years, Luxury Living has grown in expertise. Specialties include residential leasing and sales, multifamily thought leadership, and award-winning apartment marketing for Class A Chicagoland apartments. This month, the company celebrates 15 years of success, reflects on past accomplishments, and looks toward the future.

Luxury Living has grown and evolved in so many ways since launching in 2007,” said Aaron Galvin, Founder and CEO at Luxury Living. “With this evolution, it felt like time to refresh our branding to reflect the company we are today and where we are headed. In becoming a nationally recognized vertically integrated real estate company, we have removed the words Chicago and Realty from the name. Today and looking ahead, we are Luxury Living, with an emphasis on Living.”

Company Growth

Founded by CEO Aaron Galvin and Chief Culture Officer Amy Galvin, Luxury Living started from humble beginnings in a River North apartment. Today, the company remains headquartered in the River North neighborhood of Chicago and has a team of over 60. The people of Luxury Living include a mix of operations, accounting, marketing, brokers, and leasing professionals supporting the firm’s exclusive marketing and leasing assignments and Chicagoland renters and homebuyers.

The company’s continued year-over-year growth and expertise continue to earn accolades across the real estate and business community. Inc. 5000 and the Financial Times have named Luxury Living one of the fastest-growing companies in North America for the past five years. The company made GlobeSt.com’s 2022 list of Multifamily Influencers, and CEO Aaron Galvin was also honored as Executive of the Year at the 2022 Illinois Real Estate Journal Awards. Year after year, the marketing team has won numerous awards for apartment marketing, content marketing, lead generation, COVID response, and more.

Investment In Culture

“Over the last few years, we’ve been focused on creating an empowering and inclusive culture. We’re seeing the benefits of these initiatives with minimal turnover during a period of significant growth,” said Amy Galvin. “We’re proud that over 20% of our team members have been with the company for five or more years, and we believe culture will be key to our future success. This is why we’ve implemented multiple new “human first” initiatives to curtail burnout, celebrate our people, and enhance employee retention.”

This year, Luxury Living set a company goal of 500+ hours of company-sponsored learning and development opportunities, including wellness initiatives like Nivati, which provides access to 1:1 coaching, therapy, nutrition, and fitness. The company also committed to the team’s professional development growth, which has already resulted in several promotions throughout the year. Luxury Living also has an industry-leading paid time off policy including extended paid family leave, time off for life disruptions, mental health days and birthdays. Benefit offerings include best-in-class health and life insurance and a company contribution towards retirement.

Learn more about joining the Luxury Living team at www.LuxuryChicagoApartments.com/join-our-team/.

Market Expertise

Luxury Living is Chicago’s most experienced development leasing company, securing over $5 billion in capitalized value for owners while leasing nearly 35% of all new apartments in downtown Chicago. The company has leased over 20,000 apartments and sold 200 condos across 50 exclusive leasing and sales assignments. Lincoln Common, Wolf Point East, Wolf Point West, One Oak Brook Commons, and Logan Apartments are some of the company’s most prominent exclusive marketing and leasing engagements. The company is also consulting on 15 new luxury developments set to deliver starting in 2024.

With the power of the brokerage team and marketing strategy coupled with the process and efficiency of our exclusive development leasing platform, Luxury Living has become the go-to brokerage for the top multifamily developers and capital partners in Chicago. The company is known for achieving record-setting rents while optimizing revenue. Developers and investors seek out Luxury Living for its leasing, pricing and renewal strategies paired with award-winning apartment marketing. Using their expertise, the company is also a general partner on its first multifamily development, a new chapter for the firm.

Looking Ahead

In April 2022, Luxury Living entered the development arena. Partnering with Mavrek Development, GW Properties, and Double Eagle Development, the firms are co-developing The Saint Grand, a mixed-use project at 218 E. Grand in Chicago. The development will feature 248 residential apartments, 8,000 square feet of ground-floor retail space, and 41,000 square feet of office space. Residential units are anticipated to deliver in early 2024.

“Developing is a natural next step in the progression of Luxury Living,” said Galvin. “As a developer, we can use the rental trends we see in the market to inform the architecture, design, and operations of a property. We look forward to expanding this line of our business over the coming years.”

Chicago Class A Multifamily Market Update — Updated November 2022

Luxury Living consistently tracks leasing data on larger assets in Downtown Chicago’s Class A Market built after 2016. This dataset currently includes ≈60 properties and just over 22,000 total units. These properties set the tone for the entire market. 

Tracking leased rentals as opposed to available units (asking rents) shows what is actually happening in Chicago multifamily. Furthermore, showing how the average gross rents compare to average SF is equally as important, as PPSF has a major impact on how a property is perceived in the market.


Q3 2022: Quality Over Quantity

As expected, leasing volume in Q3 decreased significantly from ≈3,500 leases to ≈2,300 leases. 

Despite the 35% reduction in total rentals from Q2 to Q3, Chicago multifamily remained extremely strong on an average gross rent basis, rising from $3,037 in Q2 up to $3,117 in Q3 (+2.7%)

Seasonality impacts Chicago as much as any city in the country, but high occupancy and retention made it possible for rents to actually rise in Q3 as rental volume dropped by more than one-third.


Q2 vs. Q3 — Rental Data

Average gross rent increased in four downtown neighborhoods and decreased in three neighborhoods. The below chart shows the variance in average gross rent from Q2 to Q3 by neighborhood.

 Average Gross Rent


  • River North saw the largest increase in average gross rent, rising $283 (+8.7%). 
  • Gold Coast/Old Town had the largest decrease in average gross rent, dropping $317 (-9.1%).
  • Despite the major fluctuations, the average gross rents increased $81 in Q3.


Digging Deeper

  • River North had a huge increase in average rents in Q3 when compared to Q2, rising $283 on average.
    • Why? 
      • Average rents for 2 Bedrooms increased $439 (+9%), rising from $4,429 to $4,868.
  • Gold Coast/Old Town had the largest decrease in average gross rent, dropping $317 (-9.1%).
    • Why?
      • With fewer ultra-premium units leased in Q3, the average 2 Bedroom rent dropped from $5,029 in Q2 to $4,254 in Q3 (-15.4%).

 Average Square Footage

A common perception is that higher gross rents mean higher square footage. This data proves that is not always the case.

Digging Deeper

  • South Loop had a substantial $149 increase (+5.5%) in average gross rent, while only showing a difference of 31 SF.
    • Why?
      • Average gross rents for 2 bedrooms rose $203 on average, while accounting for 5% more of the total inventory leased in Q3 than Q2.
  • The Loop/Lakeshore East spike of 108 SF (+14.3%) and gross rent increase of $113 (+3.8%)?
    • Why?
      • There were 3x as many 3 bedroom rentals in Q3 compared to Q2, with an average gross rent increase of nearly $800.
  • The average SF in Streeterville was nearly identical, while the average gross rent dropped from $3,656 to $3,474 (5.0%):
    • Why?
      • All unit types saw a rent decrease, but a $1,299 (-17.7%) drop in average gross rent on 3 Bedrooms had quite an impact.
      • 1 Bedrooms, which represented 57.3% of the total Streeterville rentals in Q3, saw a rental decrease of 7.6%, while the 1 Bedroom average SF was nearly identical to Q2 (796 vs. 784).


At Luxury Living, we not only provide data, but analyze the data to help inform developers and capital partners make the best decisions on pricing strategy, unit mix and amenity programming.


Click Here to Download our Q3 Chicago Class A Multifamily Market Update

Luxury Living Chicago Realty Presents Fulton Market Multifamily Data

Luxury Living Chicago Realty’s CEO Aaron Galvin delivered a presentation at Bisnow’s The City of Fulton Market event on July 13. During the presentation, Galvin outlined the company’s growth over the past 15 years while also forecasting what’s to come for multifamily in Chicago’s West Loop/Fulton Market.


The Growth of LLCR


Galvin began his presentation by recognizing his team of 70, which has leased more than 20,000 apartments over 15 years — comprising a staggering 35% of all new unit leasing in downtown Chicago. With a focus on Class A leasing and luxury condominium sales, the LLCR team has expertly leased or sold $5 billion+ in capitalized value.


chicago's most experienced slide 


By collaborating with numerous developers, capital partners, and multifamily partners, advising across all areas of the development, marketing, and leasing process, Galvin said that LLCR is ensuring “success with these multi-million-dollar investments that make up the fabric of our city.”


TruRent – Real Time Class A Apartment Data


 To best understand what makes Chicago multifamily successful, Galvin said it is first necessary to delve into the mind of the Chicago luxury tenant. “Renting an apartment is one of the most financially and emotionally significant decisions in someone’s life” noted Galvin.  LLCR recognizes this and provides both qualitative and quantitative data for renters and developer clients. 


Over the last two years, LLCR has developed TruRent, a proprietary technology platform that captures real-time data on Chicago’s Class A luxury apartments. LLCR is now tracking nearly every unit that comes on the market in Chicago and every unit that gets leased at the actual unit level. 


trurent slide


This allows the company to create the most accurate market studies which help inform pricing for our current clients and future developers and capital partners.


Historical Delivery Data


Touching on the historical data of the area since 2016, Galvin said the area has had approximately 4,000 units deliver — mostly from 2019-2021. For the properties delivered to date, the average size of the building is right around 300 units with an average unit size of about 750 SF.


historical data slide


All of these properties have extensive interior and exterior amenities and upscale finishes including stainless steel appliances, quartz countertops, luxury plank flooring, an in-unit washer-dryer, and custom closets. These are some of the nicest buildings in the city.


Current Market Data


In total, there have been about 25,000 new luxury apartments delivered to these neighborhoods since 2016 across 60 properties. 


Based on data from Q2 2022, Galvin said Chicago’s multifamily market is robust, with Class A luxury apartments 94%+ occupied and average rents at an all-time high of nearly $4.00 per square foot. The average gross rent exceeded $3,000 in Q2 2022. 


On both a PSF basis and Gross Rent basis, Old Town/Gold Coast leads the way with River North and Streeterville slightly behind. All of these submarkets have had significant new deliveries in the past 2-3 years at the very top of the market. 


In West Loop/Fulton Market, the most recent price-per-square-foot is $3.93 and the average rent is $2,903. The only reason West Loop/Fulton Market is not higher is due to the lack of view premiums. For comparison, the average height in West Loop/Fulton Market is 19 stories. Streeterville’s average is 47 stories. High-floor units in most neighborhoods feature lake and city views which renters are willing to pay a premium for.  


As larger scale and taller properties deliver in the next few years in Fulton Market, Galvin predicts West Loop/Fulton Market average rents will exceed Loop/Lakeshore East and be on par with River North and Streeterville.


West Loop/Fulton Market YTD


With minimal supply and increasing demand, rents have continued to increase YTD in this submarket. 


current market trends slide


Galvin also noted, there are minimal concessions in the West Loop or really any other submarket. Most Lease-Ups, including two in Fulton Market/West Loop, have been offering 1-month of free rent. There have not been any concessions offered on renewal leases and we are seeing lease trade-out increases of 15-20%, burning off all pandemic concessions.  


Concessions will remain a part of the landscape during the lease-up but data is proving the market can absorb these gross rents.


Future Pipeline


“With current fundamentals stronger than ever, developers and capital partners are ready to invest in the city of Fulton Market,” Galvin said. “We’re entering a period of significant growth.”


In total, there have been roughly 4,000 Class A units delivered to this submarket since 2016.


In total, LLCR projects ≈10,000 new units added to this submarket in the next 3-5 years. This would be 28 new multifamily properties added to West Loop/Fulton Market.  


future pipeline slide


Galvin concluded with the following: 


“No one year is going to overwhelm this market. A popular Chicago neighborhood like Fulton Market can absorb 2000, even 2500 units in one year. Everyone can be successful here”


Real-Time Pipeline


If you are interested in access to the only real-time Class A pipeline in the market, please click here and provide your contact information.

Sign Up to Receive Industry Insights

Luxury Living is here to help you in all aspects of multifamily development. From pre-development consulting to marketing and leasing, we are Chicago’s multifamily leasing expert.