Chicago Class A Multifamily Market Update — Updated July 2023
Luxury Living consistently tracks leasing data on larger assets in Downtown Chicago’s Class A Market built after 2016. This dataset currently includes 68 properties and just over 22,000 total units—and counting. These properties set the tone for the entire market.
Tracking leased rentals as opposed to available units (asking rents) shows what is actually happening in Chicago multifamily.
Consistent with Q1 2023, the top three submarkets—West Loop/Fulton Market, South Loop and River North—had 69% of the total rentals in Q2 2023.
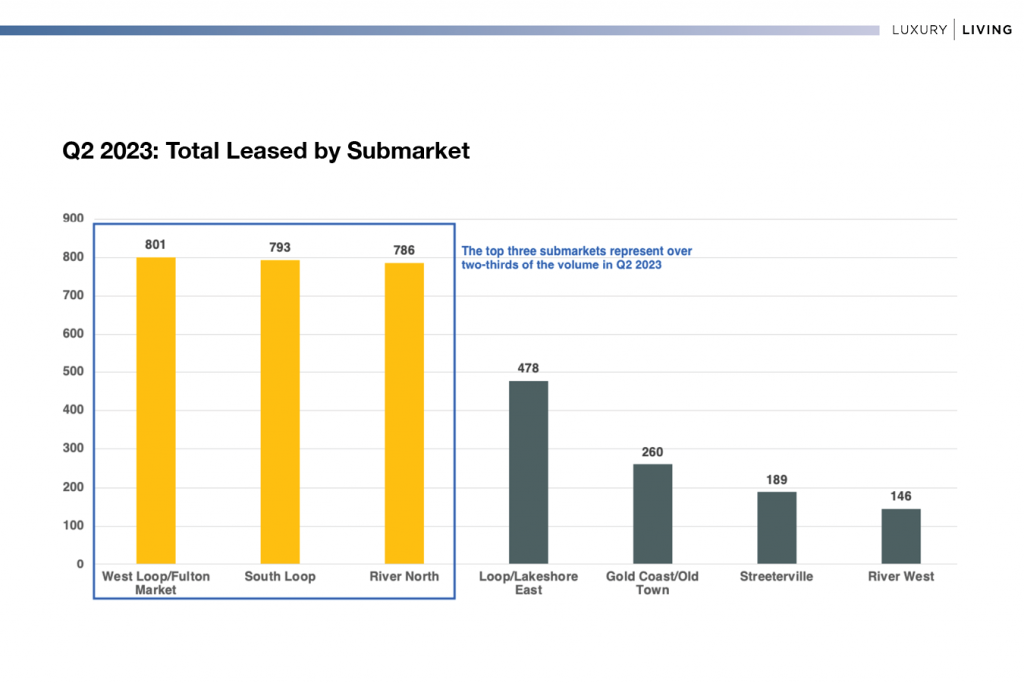
The biggest difference in Q2 2023 is West Loop/Fulton Market taking the #1 spot over South Loop. In Q1 2023, South Loop had 20% more rentals than River North, and 28% more rentals than West Loop/Fulton Market. This is quite a shift.
West Loop/Fulton Market is getting stronger by the day. Lease-ups in this submarket contributed 31.8% of the total rentals this quarter.
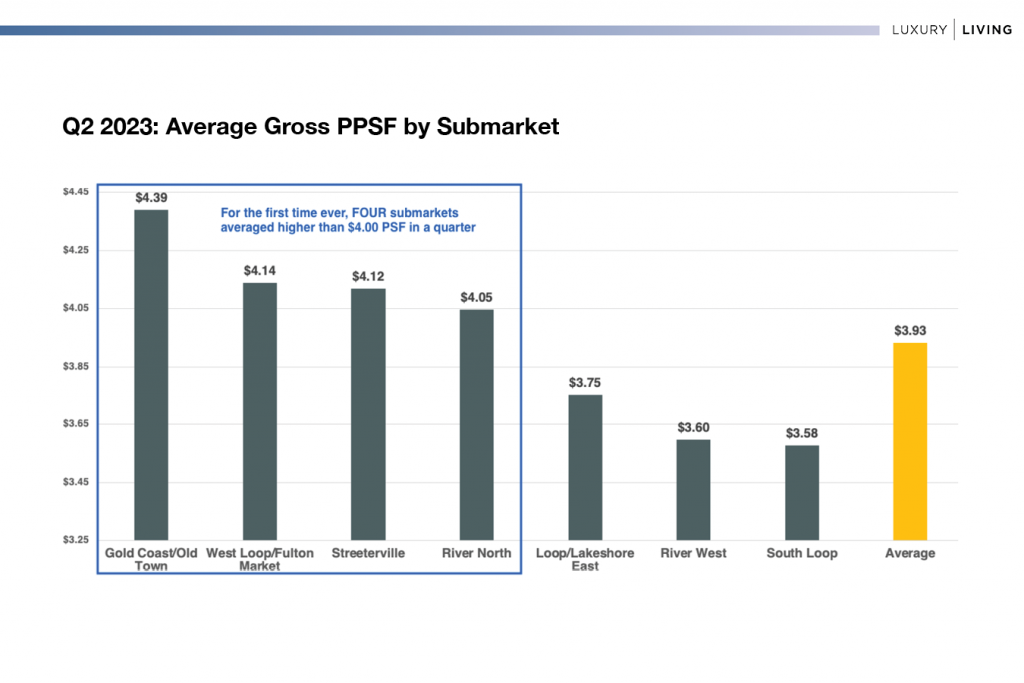
While Gold Coast/Old Town didn’t have quite the volume, it far-surpassed its competitors on a gross PPSF basis, achieving an astounding $4.39 PSF in Q2 2023. That is 6.1% higher than the second-highest achieved PPSF in the market at $4.14. It’s also 11.6% higher than the market average.
This marks the first time four submarkets surpassed $4.00 PSF on achieved rentals in a single quarter.
There is still substantial disparity for South Loop, but gross PPSF did rise 5% from a low of $3.41 in Q1 2023.
What’s more, when South Loop is removed from the set, the average for the market rises to $4.04 PSF.
One of the most important data points in Chicago multifamily is tracking leasing trends by unit type. There are so many factors that play into this, whether it’s single renters or couples leasing more units, a rise in relocations to Chicago, rents spiking, which impacts affordability and qualifications, to a slew of other economic factors.
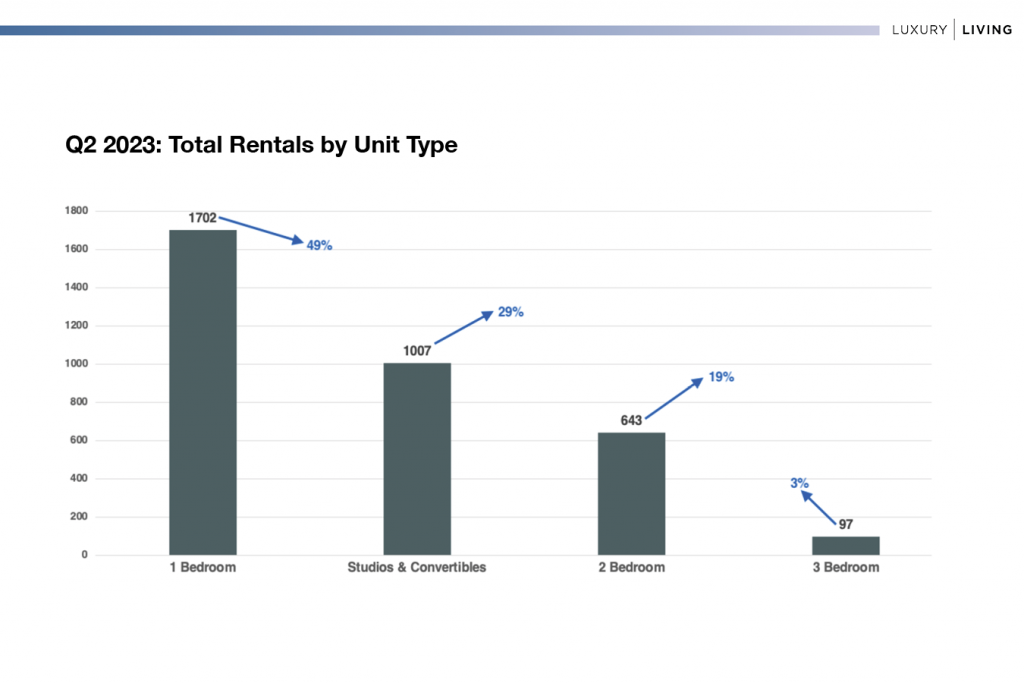
Historically speaking, 1 bedroom rentals equate to 45–50% of the total in Chicago, while studios & convertibles usually range closer to 20–25%. The shift in the market over the last few years is 2 bedrooms are starting to fall below 20% of the total rentals in the market.
Why is this happening?
The average rent for a 2 bedroom in Q2 2023 was just under $4,300, which is the exact same average gross rent in Q2 2022.
To qualify for the average 2 bedroom, based on income of 3x the monthly rent, an individual would need to make $155,000 per year. Yes, couples often lease 2 bedrooms and have dual income, but the idea is to attempt to save money—the average rent compared to the average qualifying income is 33.1%.
32% of the 2 bedrooms leased in Q2 had a gross rent $4,500 or higher. The average for this group of units was $5,212, and to qualify would require an individual income of $188,000.
1 bedrooms, which consisted of 49% of the total rentals in Q2 2023, had an average gross rent of $2,825 and an average SF of 723. The smaller SF is a trend that is consistent, but that also means these units are less likely to be leased by couples. To qualify for the average 1 bedroom, an individual would need to make $102,000 per year.
As rents continue to rise, Chicago multifamily needs to continually consider demographics to ensure the inventory in the pipeline not only meets renter demand, but affordability does not impact absorption.
At Luxury Living, we not only provide data, but analyze the data to help inform developers and capital partners to make the best decisions on pricing strategy, unit mix, and amenity programming.
Click Here to Download our Q2 Chicago Class A Multifamily Market Update
Luxury Living is here to help you in all aspects of multifamily development. From pre-development consulting to marketing and leasing, we are Chicago’s multifamily leasing expert.