Chicago Class A Multifamily Market Update — Updated October 2023
Luxury Living consistently tracks leasing data on larger assets in Downtown Chicago’s Class A Market built after 2016. This dataset currently includes 70 properties and over 23,000 total units—and counting. These properties set the tone for the entire market.
Tracking leased rentals as opposed to available units (asking rents) shows what is actually happening in Chicago multifamily.
When comparing the total rentals by submarket in Q2 2023 to Q3 2023, it’s inevitable to see a drop-off. Q2 is historically the highest-volume quarter of the year.
But, when there is a submarket with five lease-ups like there was in West Loop/Fulton Market, let’s just say that has some serious pull.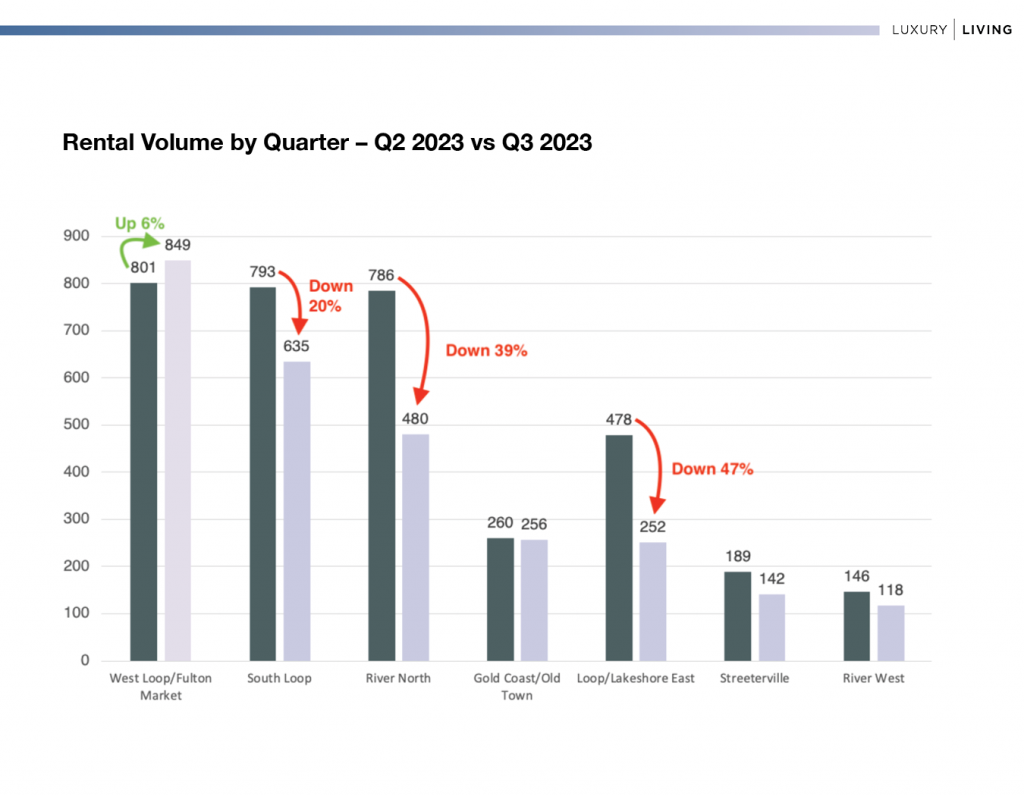
The average of all submarkets combined for a drop in leasing volume of 21%, while West Loop/Fulton Market held strong, and was UP 6% over the previous quarter.
This is what happens when five lease-ups are simultaneously duking it out for renters heading into the slowest part of the leasing season—the dreaded September + Q4.
Concessions were a major factor for these lease-ups, and it shows how impactful they were compared to the six other submarkets.
In Q2 2023, lease-ups contributed 31.8% of the total rentals in the West Loop/Fulton Market submarket. In Q3 2023, this number jumped to 42.5% of all leasing volume in West Loop/Fulton Market.
With eight lease-ups launching in Q4 2023 through 2024—2,000 more units—it’s more than likely this trend will continue.
Luxury Living has always defined the “busy season” in Chicago as March through July…and half of August. These months are when the vast majority of leasing occurs throughout the year. 2023 was no different.
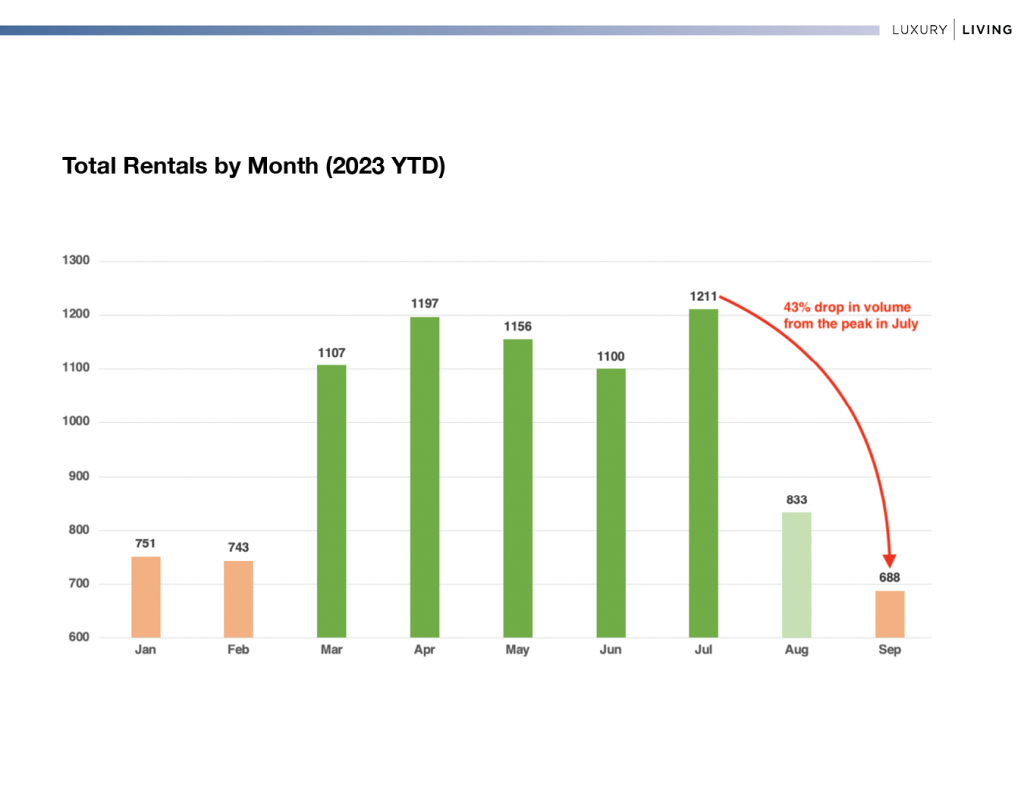
March through July is really the peak, where 66% of the total rentals occurred during these 5 months. The drop-off in September is always expected. But, just like temperatures falling from mid-70s to low-40s, we’re always somehow shocked when it happens.
The market will hover in the 500 to 800 range until March of next year. No matter what revenue management software attempts to do, there just aren’t enough renters looking for apartments in September through February to make a dent.
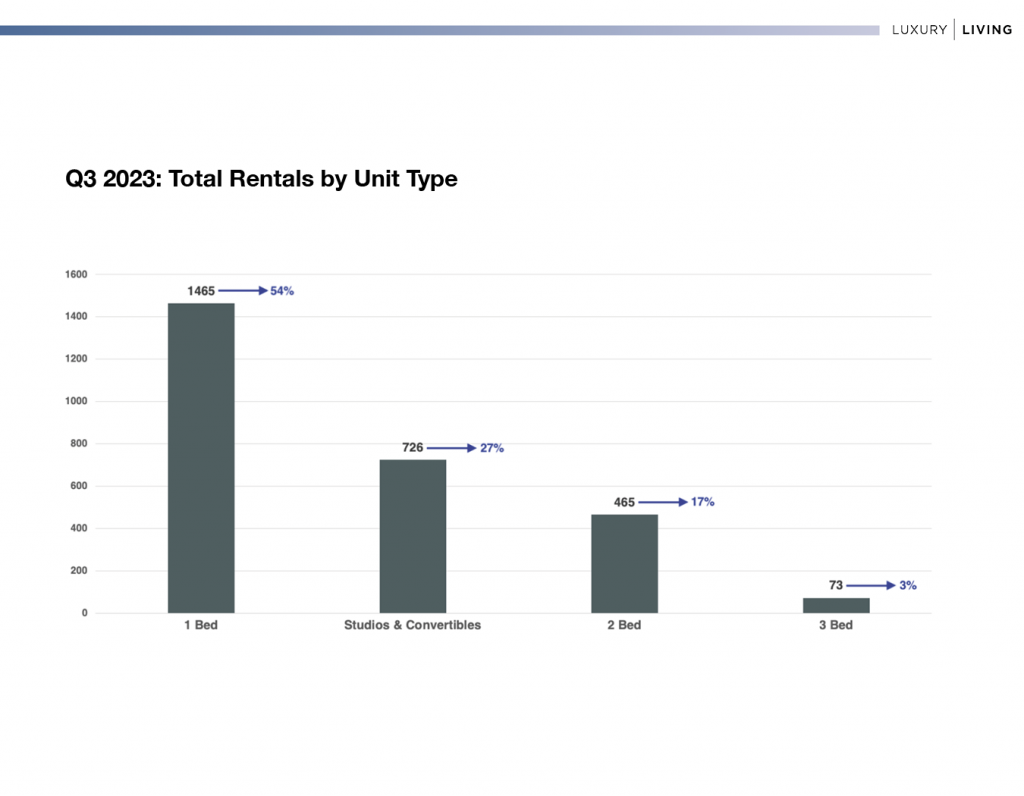
One of the most important data points in Chicago multifamily is tracking leasing trends by unit type. There are so many factors that play into this, whether it’s single renters or couples leasing more units, a rise in relocations to Chicago, rents spiking, which impacts affordability and qualifications, to a myriad of other economic factors.
As rents rise during peak leasing season in Chicago, renters will have to choose between a larger apartment in an older building, perhaps sacrificing location, or a smaller apartment in a new property, in their desired location. Budgets and wish lists can be like oil and water.
Comparing Q2 to Q3 2023, 1 bedroom apartments had the largest change in market share, rising from 49% to 54%. 1 bedrooms are generally in the 45% to 50% range, so to see this unit type above 50% is above average.
The average 1 bedroom gross rent in Q3 was $2,754 (Average SF: 716 / Average PPSF: $3.85). Of the 1,465 1 bedroom rentals in Q3, 694 had a square footage of 716 or lower (47.4%), while 771 had a square footage larger than 716 (52.6%).
As rents increase around the city, studios and convertible rentals have been on the rise over the last few years due to affordability.
The average studio/convertible gross rent in Q3 was $2,177 (Average SF: 525 / Average PPSF: $4.15). Renters paid an average of $576 more (+27%) to live in a 1 bedroom that’s 191 SF larger (+36%).
While the average gross rents for 1 bedrooms remained consistent in Q3, staying within the range of $2,718 to $2,772, the studios/convertibles saw the biggest drop from July to September.
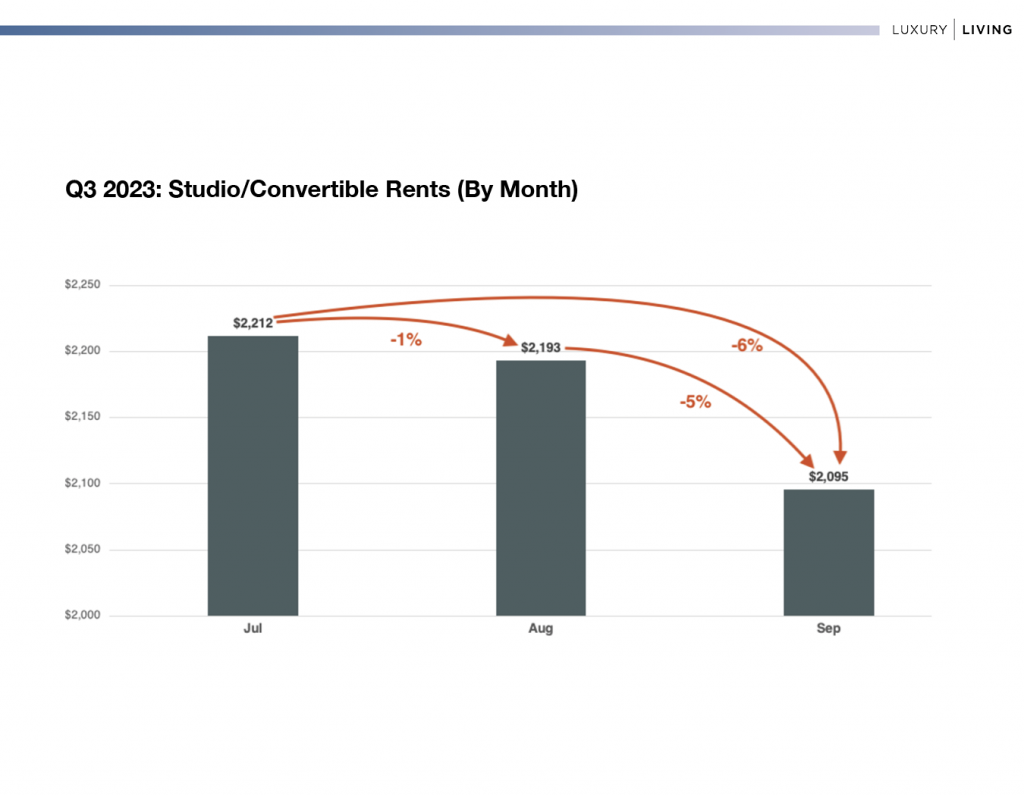
There was only a 1% drop in gross rents from July to August, but a 6% drop in gross rents from July to September. The square footage was still very close—519 vs. 530—which makes the drop in gross PPSF from $4.26 PSF down to $3.95 PSF even more impactful.
This is why Q3 can be so misleading. July and half of August are generally solid leasing months in Chicago, but September is a bit of a wet blanket, always ruining the party.
As seasonality causes havoc in the market, it’s critical to understand why this is happening, and how to prepare for it. Whether that is staying ahead of the market with concessions, or optimizing a lease-expiration schedule, there is always a way to stay ahead when you know what’s coming.
At Luxury Living, we not only provide data, but analyze the data to help inform developers and capital partners to make the best decisions on pricing strategy, unit mix, and amenity programming.
Click Here to Download our Q3 Chicago Class A Multifamily Market Update
Luxury Living is here to help you in all aspects of multifamily development. From pre-development consulting to marketing and leasing, we are Chicago’s multifamily leasing expert.