Chicago Class A Multifamily Market Update — Updated November 2022

Luxury Living consistently tracks leasing data on larger assets in Downtown Chicago’s Class A Market built after 2016. This dataset currently includes ≈60 properties and just over 22,000 total units. These properties set the tone for the entire market.
Tracking leased rentals as opposed to available units (asking rents) shows what is actually happening in Chicago multifamily. Furthermore, showing how the average gross rents compare to average SF is equally as important, as PPSF has a major impact on how a property is perceived in the market.
As expected, leasing volume in Q3 decreased significantly from ≈3,500 leases to ≈2,300 leases.
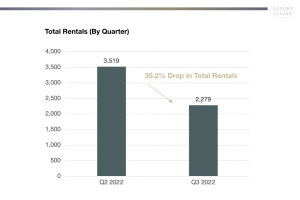
Despite the 35% reduction in total rentals from Q2 to Q3, Chicago multifamily remained extremely strong on an average gross rent basis, rising from $3,037 in Q2 up to $3,117 in Q3 (+2.7%).
Seasonality impacts Chicago as much as any city in the country, but high occupancy and retention made it possible for rents to actually rise in Q3 as rental volume dropped by more than one-third.
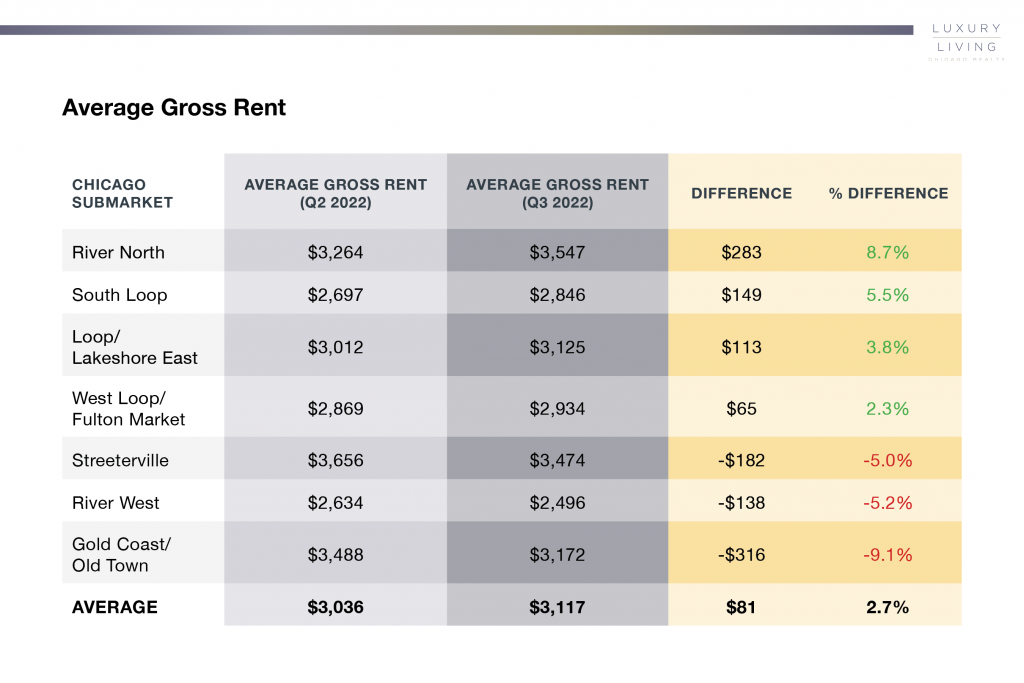
Average gross rent increased in four downtown neighborhoods and decreased in three neighborhoods. The below chart shows the variance in average gross rent from Q2 to Q3 by neighborhood.
Average Gross Rent
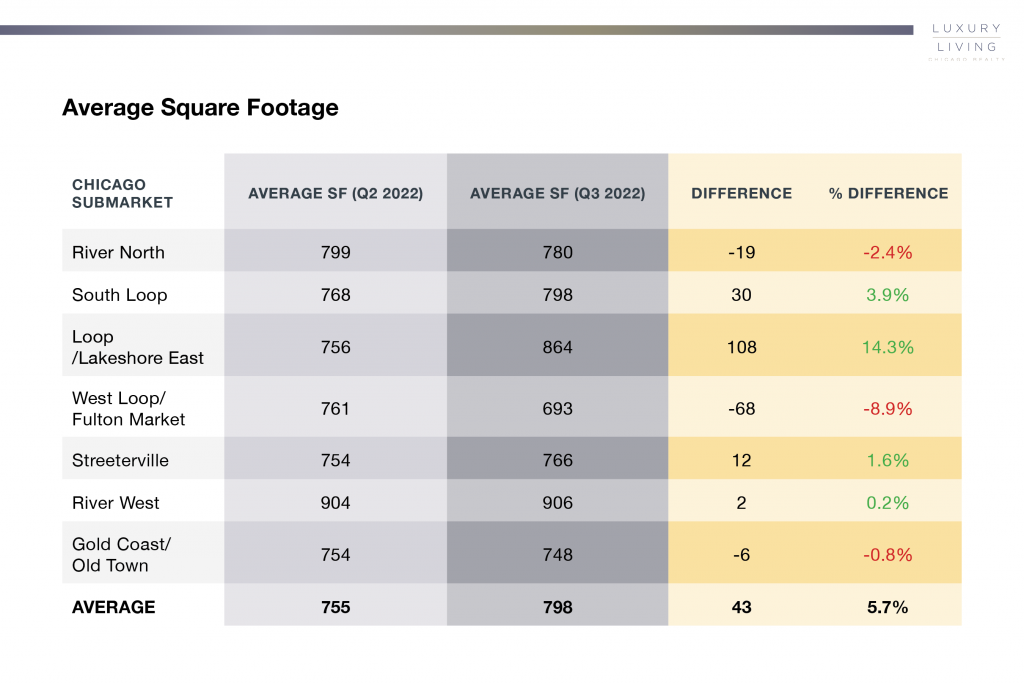
Average Square Footage
A common perception is that higher gross rents mean higher square footage. This data proves that is not always the case.
At Luxury Living, we not only provide data, but analyze the data to help inform developers and capital partners make the best decisions on pricing strategy, unit mix and amenity programming.
Click Here to Download our Q3 Chicago Class A Multifamily Market Update
Luxury Living is here to help you in all aspects of multifamily development. From pre-development consulting to marketing and leasing, we are Chicago’s multifamily leasing expert.