Chicago Class A Multifamily Market Update — Updated January 2024
Luxury Living consistently tracks leasing data on larger assets in Downtown Chicago’s Class A Market built after 2016. This dataset currently includes 72 properties and over 23,000 total units—and counting. These properties set the tone for the entire market.
Tracking leased rentals as opposed to available units (asking rents) shows what is actually happening in Chicago multifamily.
September marks the first full month of the seasonality dip, but Q4 is where property owners feel the most decrease. Fewer renters are looking for apartments during this time, and even with seasonably high concessions, the volume simply isn’t there.
There were just over 1,900 rentals in Q4, which is a 40% decrease from Q3 (2,700 rentals). For even more context, there were nearly 3,500 rentals in Q2—nearly twice as many rentals as Q4.
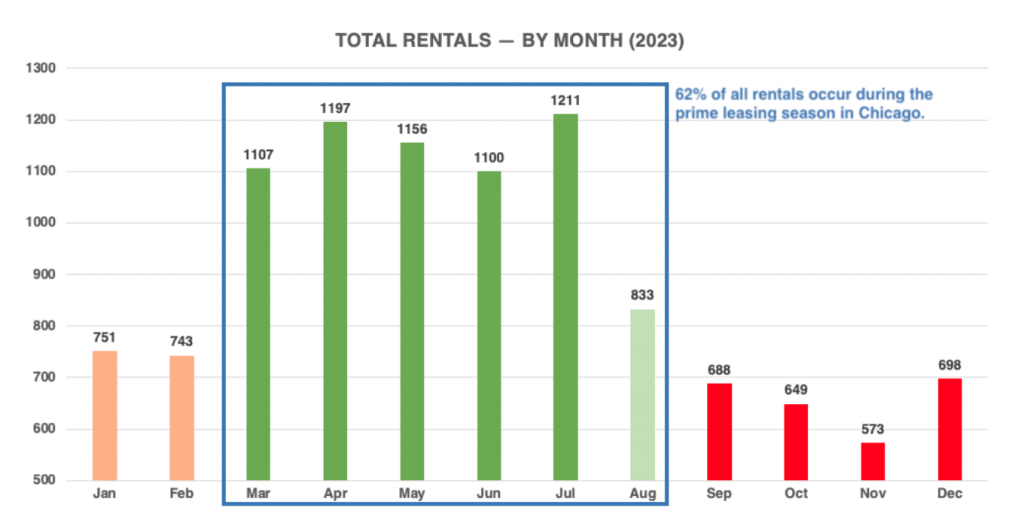
The above chart clearly illustrates why an optimized lease-expiration schedule is so important. An optimized expiration schedule not only maximizes revenue, but ensures the right inventory when renters are looking for apartments.
In Q1 2023, South Loop had the top spot in total rentals, but since that time West Loop/Fulton Market shot to #1 in Q2 and Q3 due to the high number of lease-ups that launched this year. As the West Loop/Fulton Market buildings stabilized, South Loop returned to #1 on the list in Q4 2023.
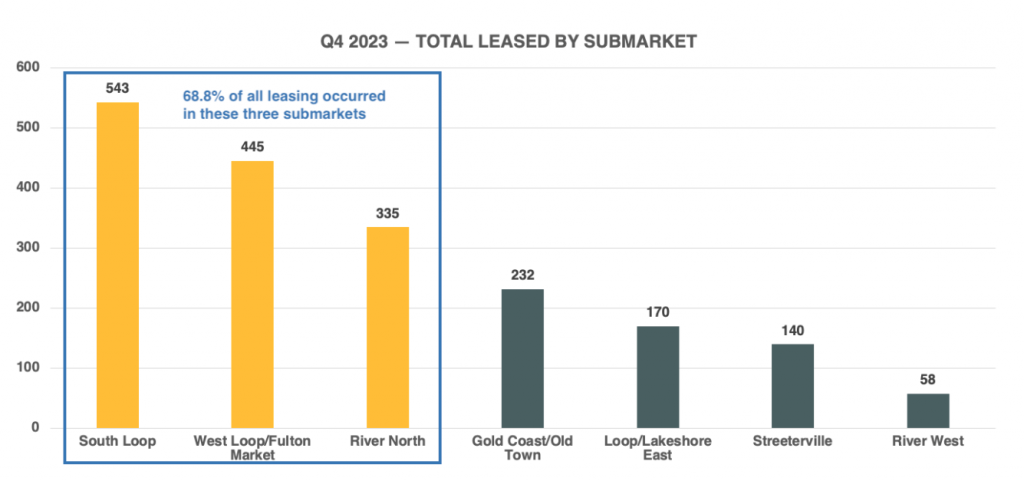
In 2024, there are lease-ups in ALL submarkets except River West and Loop/Lakeshore East. West Loop/Fulton Market will likely take the top spot again in Q2 and Q3 2024 with six lease-ups and 1,800 units delivering. 1000M, with 738 units in the South Loop, may have something to say about which submarket ends up number one in leasing volume in 2024.
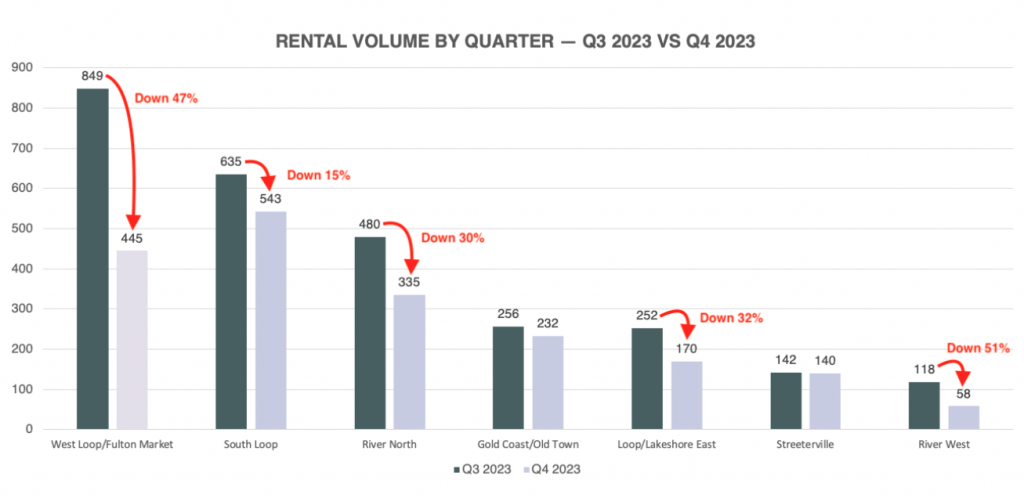
No submarket had a bigger drop in quarter-over-quarter volume than West Loop/Fulton Market. There were five lease-ups in 2023, and most hit stabilization in Q4. The leasing frenzy in Q2 and Q3 came to an abrupt halt and saw a steep decline of 47% from Q3 to Q4. The next closest volume drops were in Loop/Lakeshore East (-32%) and River North (-30%).
Technically, River West had the steepest decline (-51%), but it was only 3% of the volume for the quarter.
Streeterville was nearly even at -1.5%, and Gold Coast/Old Town did not see a significant dip, only down 9.4%.
The Average Gross Rent for the market in Q4 was only $62 lower than Q3. How is that possible? Answer: Concessions.
As the market starts to feel the burn of seasonality, the first reaction is to start offering concessions to help increase leads, traffic, and rentals. Then the comps start to also offer concessions, so more concessions are offered to stay ahead—eventually leading to 2 months of free rent, 6 months of free parking, waived admin fees, and a delicious fruit basket.
Five of seven submarkets only showed an average gross rent difference of -$34 from Q3 to Q4. The average SF in Q4 was slightly higher at 790, while Q3 was 761 (+29), so average SF was not a major factor.
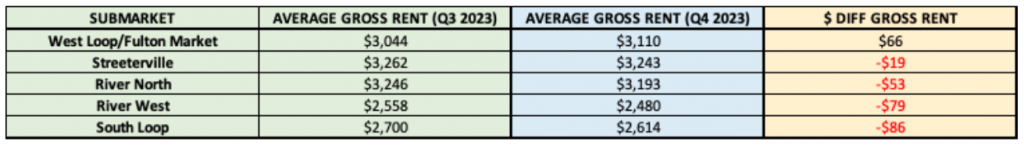
West Loop/Fulton Market was slightly higher, which makes sense. Properties in lease-up generally never lower gross rents, but will add heavy concessions to help reach stabilization. In Q4, most of the West Loop/Fulton Market lease-ups offered 1 to 2 months free.
For the remaining submarkets with mostly stabilized assets, revenue management software was adjusting rents down slightly to keep up with the market while also offering additional concessions.
Concessions will start to disappear in Q1 for stabilized assets, while properties in lease-up will keep at least one month free to ensure higher velocity. Gross rents will remain steady in January and February, and we’ll start to see the first bump in rents in March as it kicks off the busy season in Chicago.
The question is: How much growth can we expect to see in 2024 for this asset class? Chicago was among the strongest cities in the country in 2023, and we remain confident the growth trend will continue in 2024 and beyond.
At Luxury Living, we not only provide data, but analyze the data to help inform developers and capital partners to make the best decisions on pricing strategy, unit mix, and amenity programming.
Click Here to Download our Q4 Chicago Class A Multifamily Market Update
Luxury Living is here to help you in all aspects of multifamily development. From pre-development consulting to marketing and leasing, we are Chicago’s multifamily leasing expert.