Luxury Living consistently tracks leasing data on larger assets in Downtown Chicago’s Class A Market built after 2016. This dataset currently includes 85 properties and over 27,500 total units—and counting. These properties set the tone for the entire market.
Tracking leased rentals as opposed to available units (asking rents) shows what is really happening in Chicago multifamily.
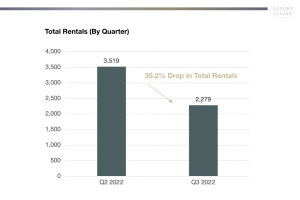
All Submarkets Increased in Volume in Q3 2024
The downtown Chicago Class A market leased just over 3,600 units in Q3 2024 vs. just over 2,600 in Q3 2023.
This increase is primarily due to the high number of lease-ups continuing to lease in different submarkets. West Loop/Fulton Market leads the way with nearly 1,000 total rentals, with South Loop just behind at 886.
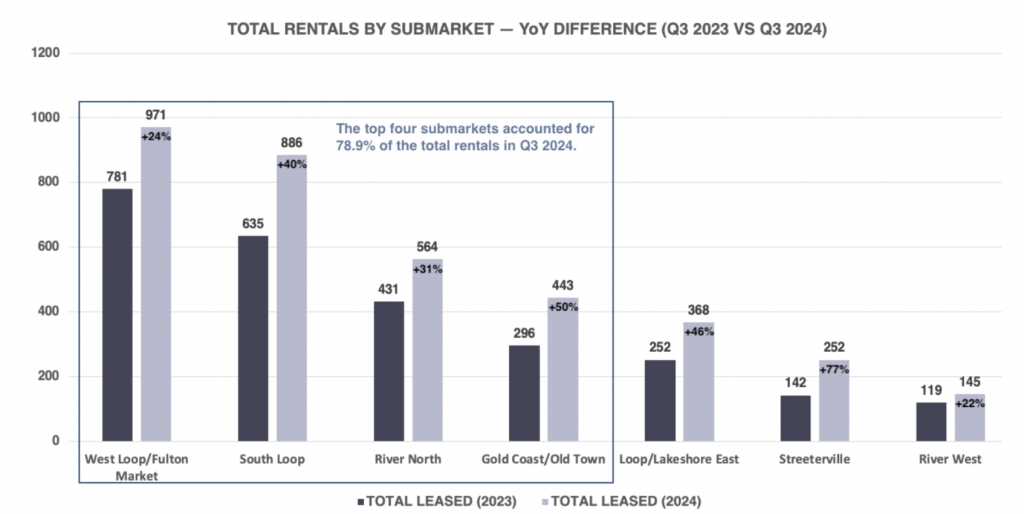
Last quarter, we pointed out that West Loop/Fulton Market, South Loop, and River North were considered “The Big Three,” but with two large-scale lease-ups in Gold Coast/Old Town, this submarket reached another level with a 50% increase in YoY volume.
The top four submarkets had more than two-thirds of the total volume in the market in Q3 2024.
Streeterville led all submarkets with a +77% increase. In a submarket with very low volume due to the number of buildings built in 2016 or later, the one lease-up made quite an impact.
Overall, the full market increased by an average of 37% from Q3 2023, which is nearly 1,000 more rentals than Q3 2024.
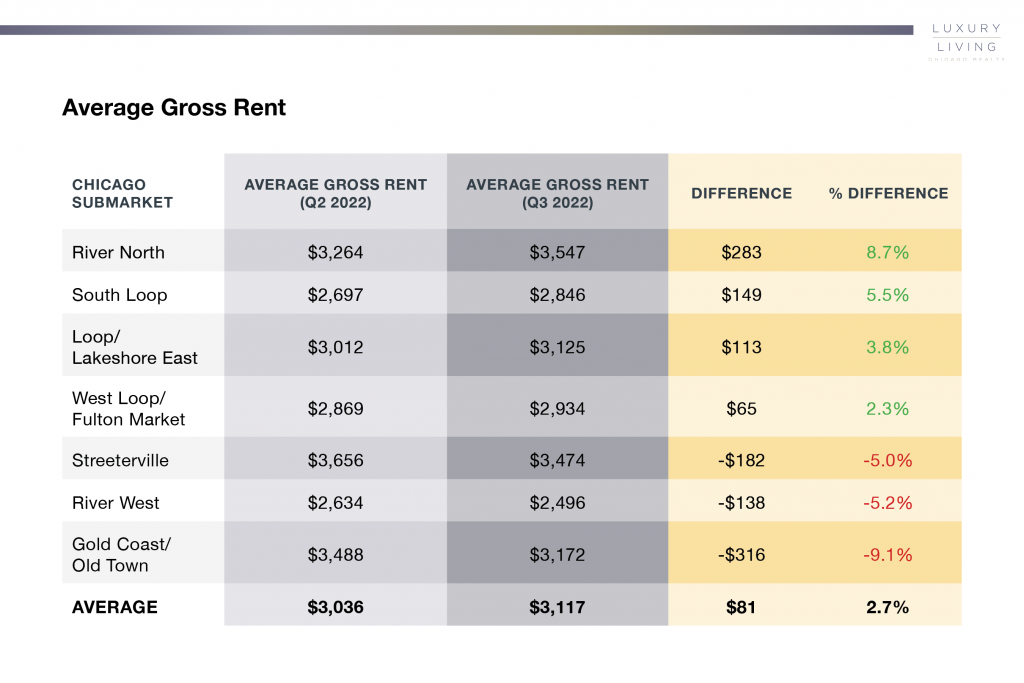
Increase in Gross PPSF
After a 2.4% increase in Q2 2024 over Q2 2023, Q3 2024 shows a continued rise in YoY gross PPSF at +1.9%.
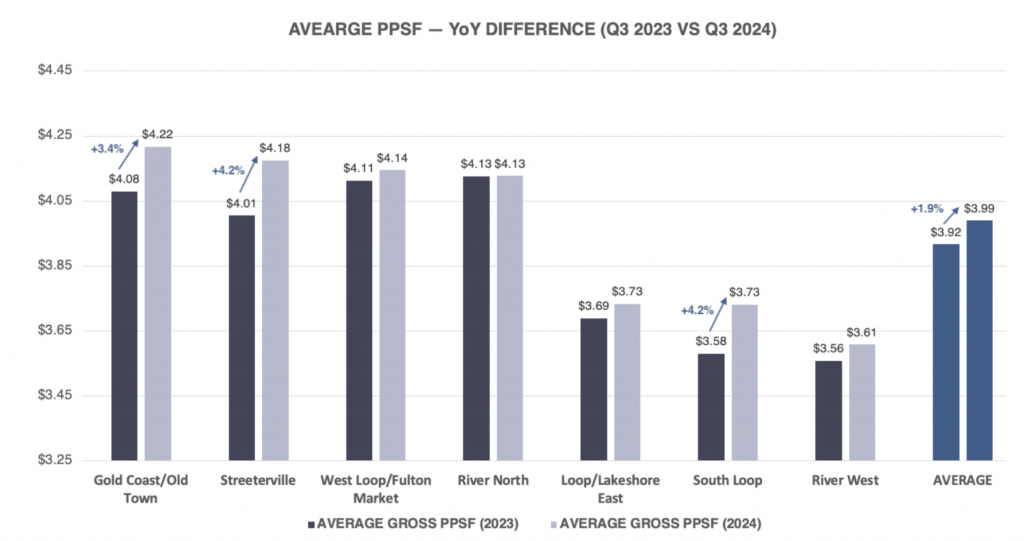
Six of the seven submarkets saw an increase in gross PPSF, while River North remained flat at $4.13 PSF.
The biggest movers were South Loop and Streeterville at +4.2% each, and Gold Coast/Old Town at +3.4%.
River West increased 1.4%, Loop/Lakeshore East increased 1.2%, and West Loop/Fulton Market increased 0.8%.
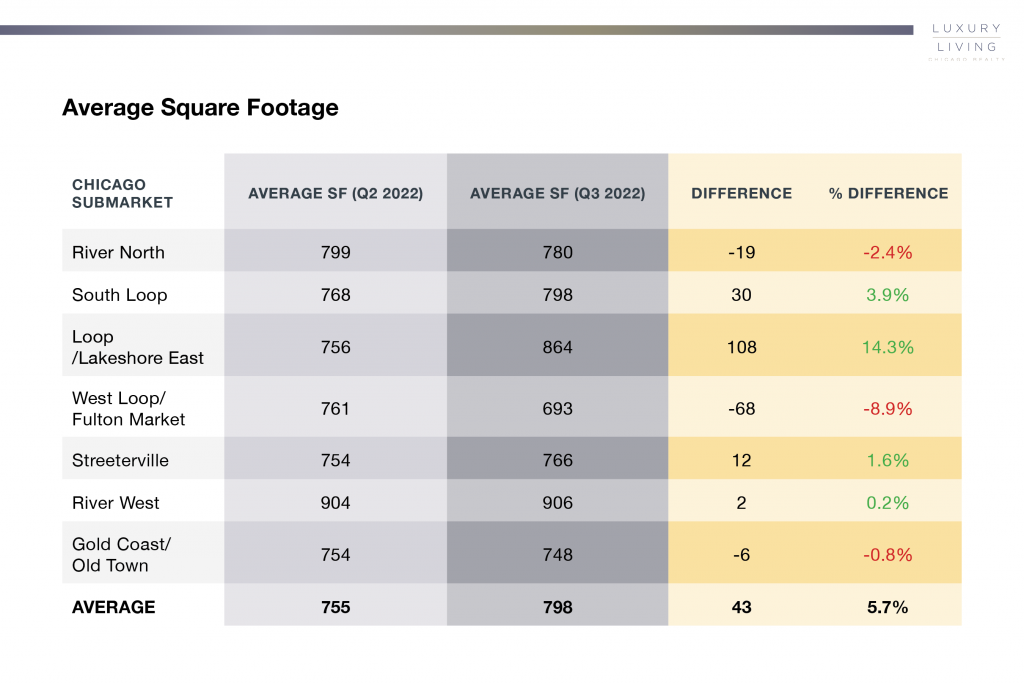
Average square footage plays a significant role in average PPSF, and there were some sizable differences YoY in each submarket.
The most important connection in the table below is the average PPSF by submarket as it relates to the average SF.
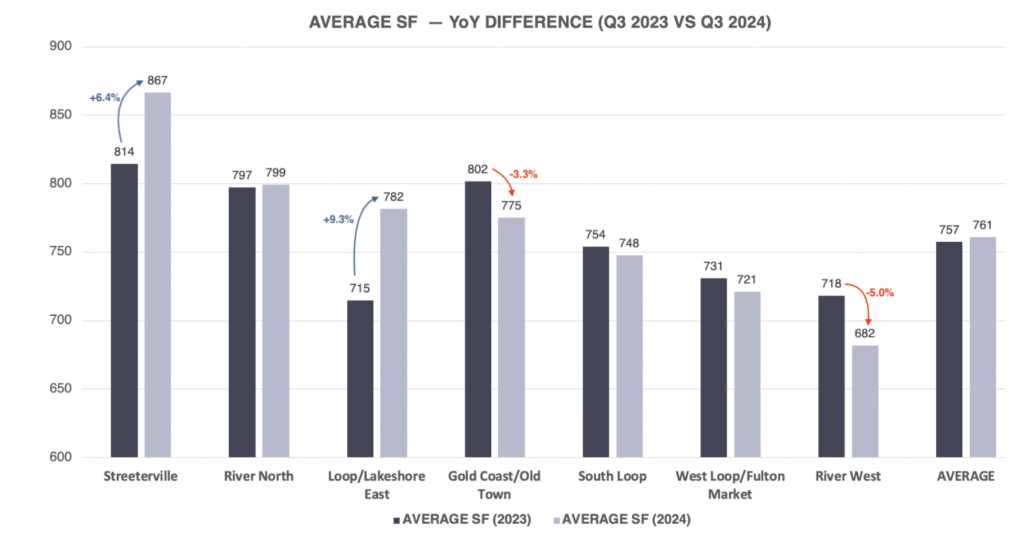
Gold Coast/Old Town is a good example of why average SF is an important metric. When comparing Q3 2023 vs. Q3 2024, the average PPSF was up 3.4%, but the average SF was down -3.3%. Another example is River West, where the average PPSF was up 1.4%, but the average SF was down -5.0%. There is growth, but the average SF impacts the perception of that growth. A general rule of thumb is that the smaller the SF, the higher the PPSF.
On the other hand, submarkets with higher PPSF and average SF are seeing the most meaningful growth. For example, Loop/Lakeshore East had a 1.2% increase in average PPSF and a 9.3% increase in average SF. Streeterville is another great example, with a sizable 4.2% increase in average PPSF and a 6.4% increase in average SF.
Looking at increases and decreases for average PPSF and average gross rent without the average SF is like looking at average completion percentage in football without looking at total passes thrown.
What are people renting?
With thousands of new units approved for zoning and seeking capitalization, the question remains: Are properties optimized to meet the market demand?
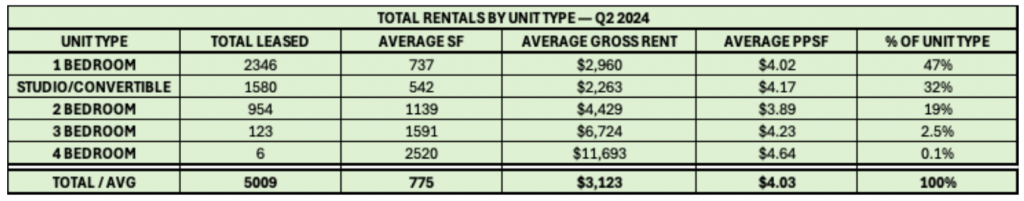
Q2 2024
Q3 2024
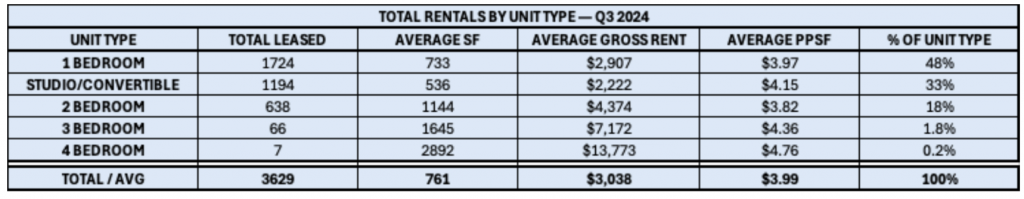
One of the most important trends we track is the percentage of unit types absorbed by the market. In the above tables, all unit types are within 1% of the previous quarter, showing consistent demand for the last 6 months.
The quarter-over-quarter average SF for each unit type is similar, which helps quantify the comparison.
We have been observing for years the increase in demand for studios and convertibles. This is not due to popularity; it’s due to affordability and income qualification. Not too long ago, these unit types made up 20 to 25% of the total volume, but they are now consistently over 30%.
For the past two quarters (6 months), the average 1 bedroom in this segmented market of 85 properties is over $2,900. This means anyone looking to qualify for one of the 4,000+ 1 bedroom rentals during this period required an average individual income of $104,400, based on the industry standard 3x the monthly rent.
In contrast, the average studio/convertible rent for the nearly 2,800 rentals averaged ~$2,250, and based on the same income qualification standards would require an average individual income of $81,000. That is a difference of $23,400 or 28.9%.
Demand for one-bedroom rentals continues to account for roughly half of the total rentals, but there has been a shift in the mix of studios/convertibles and 2 bedroom rentals over the past three years.
The single most important factor for rent growth in Chicago is high employment rates and consistent job growth in high-income industries like Financial Services, Management Consulting, Technology, and Healthcare. Incomes need to remain high to ensure high qualification for continually rising rents.
Here We Go Again
Understanding—and staying ahead of—Chicago’s seasonality is one of the most important factors for maximizing revenue in multifamily.
The graph below shows the total rentals by month for the first three quarters of 2024. It’s evident that the leasing season starts in March and ends in August.
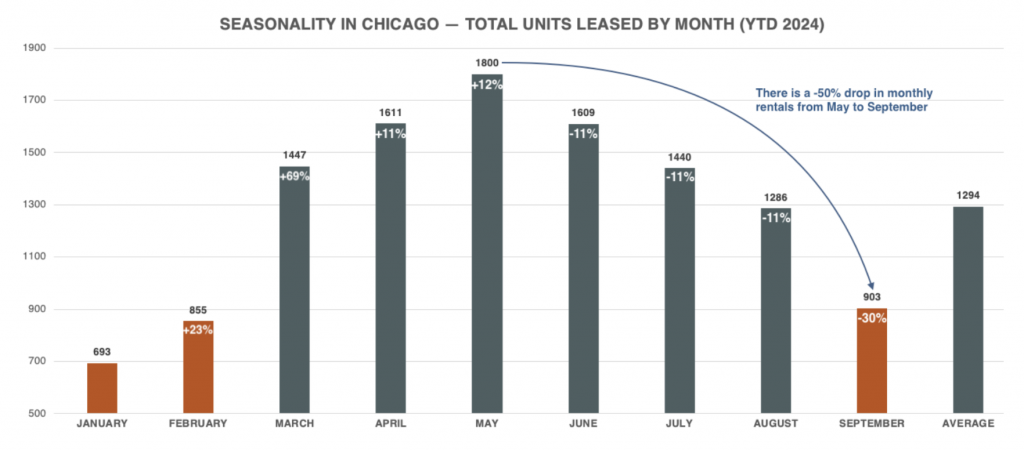
It all starts with the +69% increase in rentals from February to March, and slowly increases into May, which is consistently the highest volume month of the year.
After that, there is a steady decline of -11% per month from June through August, and then a dramatic drop of -30% in September.
August is still a high-volume month with nearly 1,300 rentals, but the market always seems unprepared for what happens every single year in September.
We will report on the full year after Q4 2024 is completed, but it’s better to know that it’s officially the slow season and competition will get fierce.
The best defense against seasonality is a flu shot, warm socks, and a fully optimized lease expiration schedule with less than 15% of expirations from September – February.
At Luxury Living, we not only provide data, but analyze the data to help inform developers and capital partners to make the best decisions on pricing strategy, unit mix, and amenity programming.
Click Here to Download our Q3 2024 Chicago Class A Multifamily Market Update