Luxury Living consistently tracks leasing data on larger assets in Downtown Chicago’s Class A Market delivered since 2016. This dataset currently includes 84 properties and over 27,500 total units—and counting. These properties set the tone for the entire market.
Tracking leased rentals, as opposed to available units (asking rents), shows what is really happening in the Chicago multifamily market.
Gross PPSF Rises Steadily Across Key Submarkets
The average PPSF in Q1 2025 was up 4.0% compared to Q1 2024.
All submarkets combined achieved an impressive $4.01 PSF, with four of the seven submarkets above $4.00 PSF.
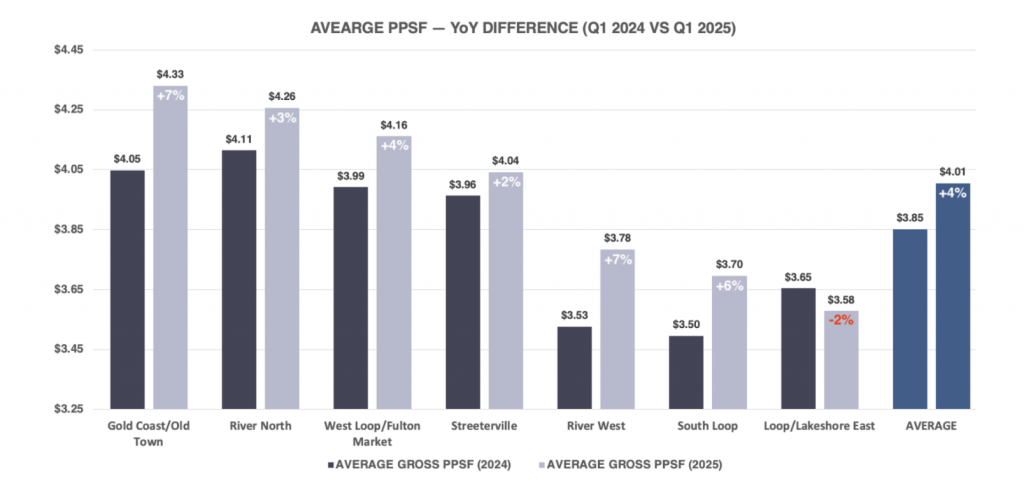
This growth reflects the continued strength of renter demand and the willingness to absorb elevated pricing, despite affordability pressures and limited new deliveries.
Several submarkets outpaced the citywide average:
- Gold Coast/Old Town led all submarkets with a 7% YoY increase, climbing from $4.05 to $4.33 PPSF—demonstrating pricing power in a majority-stabilized, supply-constrained environment.
- River West also posted a substantial 7% gain, reflecting growing interest in emerging fringe neighborhoods as renters seek value beyond traditional cores.
- South Loop followed closely, up 6%, due to the gravitational pull from one of the city’s most impressive lease-ups.
- West Loop/Fulton Market, a consistent leader in both rent growth and absorption, saw a solid 4% increase to $4.16 PPSF.
While most submarkets recorded positive YoY growth, Loop/Lakeshore East was the only submarket to decline, dropping -2% to $3.58 PPSF. Despite strong absorption volumes in the area, it’s likely the properties in this set had not yet responded to the overall demand for select unit types. We predict this will shift to positive growth in Q2 2025.
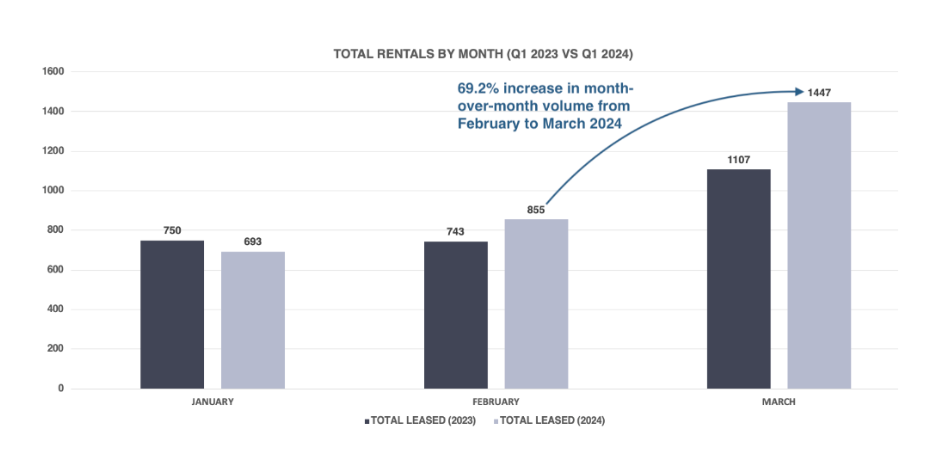
Q1 2025 Sets New Benchmark for Leasing Velocity
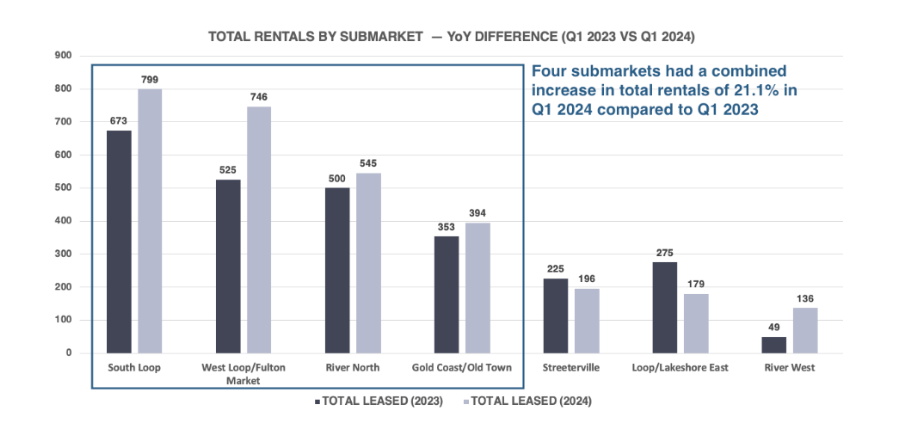
The downtown Chicago Class A market leased just over 3,300 units in Q1 2025—up 11% from Q1 2024.
To further illustrate the monumental growth in absorption, Q1 2025 is 28% higher than the total units leased in Q1 2023. Chicago multifamily is leasing units at an extremely rapid pace and is experiencing an inventory shortage.
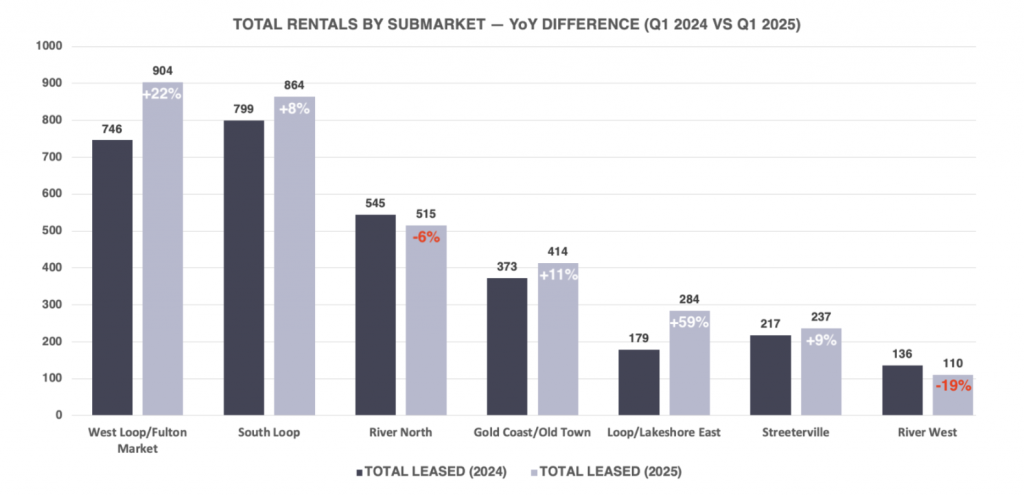
West Loop/Fulton Market and South Loop remain the most active submarkets, accounting for 52% of all units delivered since 2016. These neighborhoods continue to drive absorption, driven by strong demand and consistent new supply, which has come to a halt in 2025.
As of Q1 2025, most 2024 lease-ups are now stabilized or nearing stabilization, resulting in significantly reduced available inventory compared to the previous year. Despite this, absorption in West Loop/Fulton Market still increased by 22% YoY, while South Loop rose 8%.
Gold Coast/Old Town also posted healthy growth, with an 11% YoY increase in absorption, primarily driven by the ongoing stabilization efforts of a major lease-up project.
In contrast, River North recorded its second consecutive quarter of negative YoY absorption, down 6%—a result of a fully stabilized market as of Q4 2024. However, this submarket remains the strongest performer in terms of occupancy, with the highest leased percentages and the lowest exposure in the city.
Meanwhile, demand is shifting toward value-driven locations. The Loop/Lakeshore East submarket experienced a 59% year-over-year (YoY) absorption increase, following a 68% surge in Q4, indicating growing interest from renters in downtown core assets with relative affordability.
Digging Deeper
1 bedroom units continue to dominate Chicago’s rental landscape, accounting for approximately 50% of all leases annually. Among Class A renters, one of the most common pricing thresholds is $3,000 per month for a 1 bedroom—often including parking and utilities.
As citywide rent growth accelerates, many renters are being priced out of their preferred neighborhoods and are increasingly forced to prioritize affordability over location.
The graph below shows the average 1 bedroom rent leased in each submarket in Q1 2025.
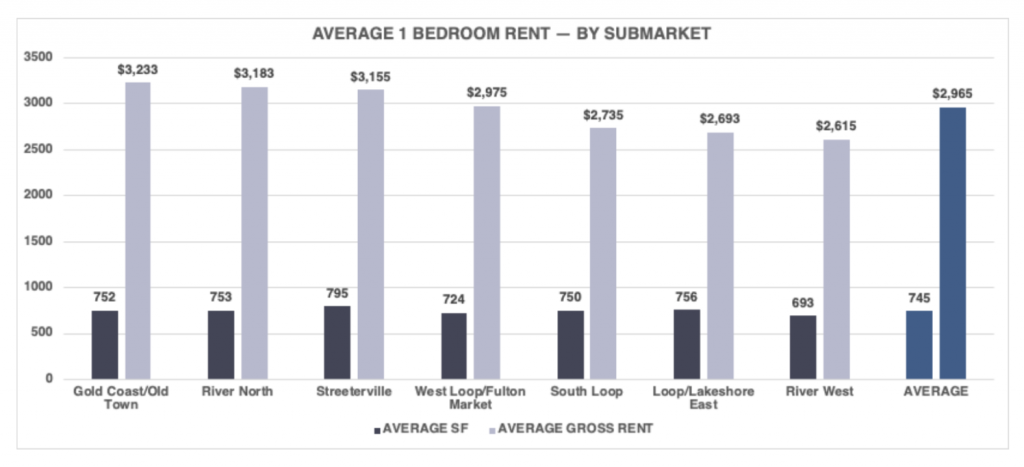
The Loop, in particular, is emerging as a value-driven alternative for cost-conscious Class A renters. With an average rent of $2,693 and a unit size of 756 square feet, the submarket offers a compelling combination of space, quality, and high-quality amenities at the lowest gross rents among downtown core neighborhoods.
For context, a single renter earning $100,000 annually qualifies for a maximum rent of $2,778 using the standard 3x rent-to-income ratio. Currently, only three submarkets offer average 1 bedroom pricing within this range—without requiring renters to downsize to a studio or convertible, or rely on a co-signer.
If recent leasing patterns continue, the Loop is well-positioned to absorb a growing share of demand, especially as limited new supply and escalating rents across the city intensify affordability pressures.
Average Square Footage is Down YoY
Average square footage is the one data point that can provide the necessary context for shifts in gross PPSF. The graph below shows the YoY square footage differences in each submarket.
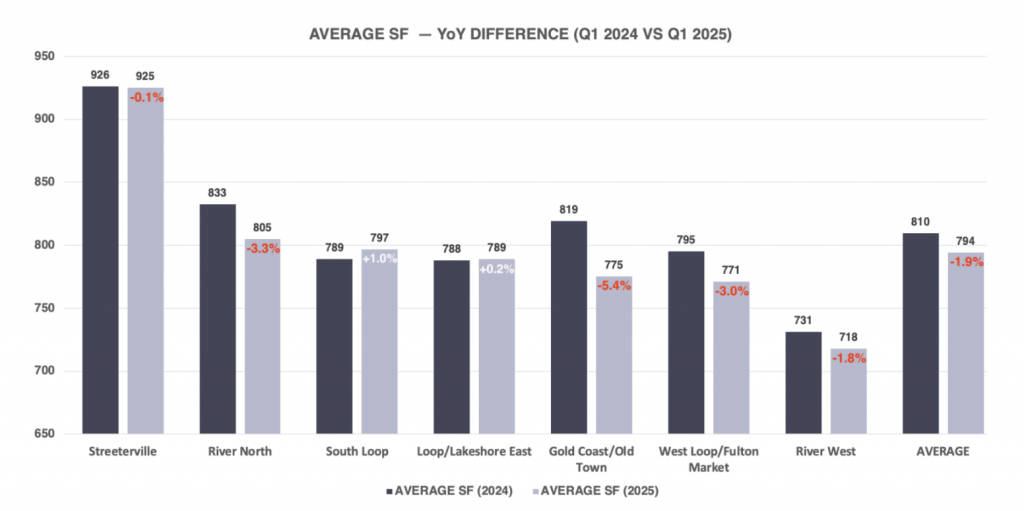
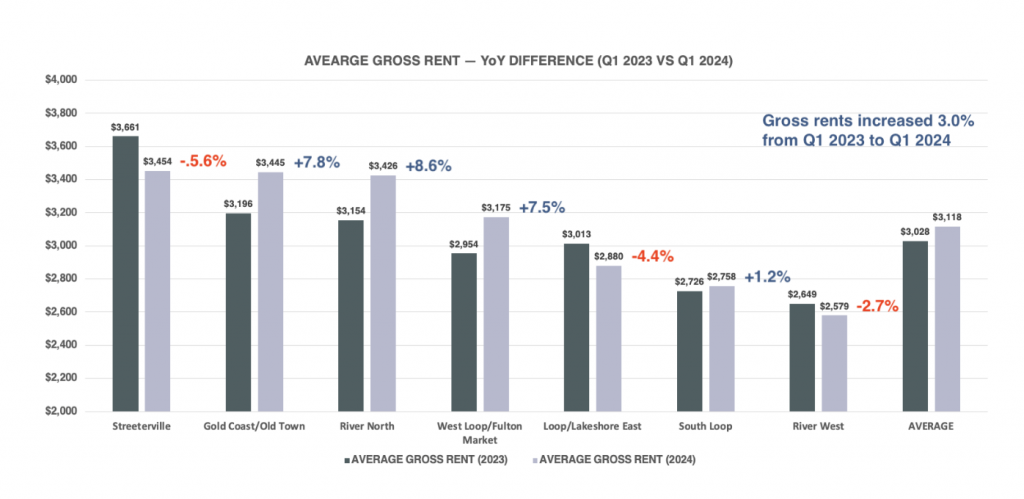
In Q1 2025, average gross rents rose 2.0% YoY—from $3,118 to $3,182. While this increase may appear modest at first glance, it becomes more significant when factoring in the 1.9% decline in average unit size during the same period. The average square footage dropped by 16 SF, indicating that renters are paying more for less space, driving rent growth on a PSF basis.
This signals rent increases throughout the market, where renters are opting for smaller, more affordable units. This dynamic is also a factor of fewer concessions in the market, where many renters relied on net rents to justify rental decisions in Q1 2024.
Referring back to the 7% PSF increase for Gold Coast/Old Town, the average SF is down 5.4% YoY. Similarly, West Loop/Fulton Market had a 4% increase in PPSF, with a 3% decrease in average SF. This is meaningful data to understand the actual performance of each submarket in relation to the average SF.
Five of the seven submarkets recorded YoY rent growth. However, South Loop stood out by outperforming on all key metrics, defying broader trends with a 6% increase in average PPSF, a 7% rise in average gross rents, and a 1% gain in average unit size.
Rent Growth by Unit Type
In a healthy market, year-over-year rent growth is expected, regardless of the season. When comparing Q1 2024 to Q1 2025, average gross rents increased +2.0%, rising from $3,118 to $3,182.
How did the individual unit types perform?
The table below shows the rent differences by unit type from Q1 2024 to Q1 2025:
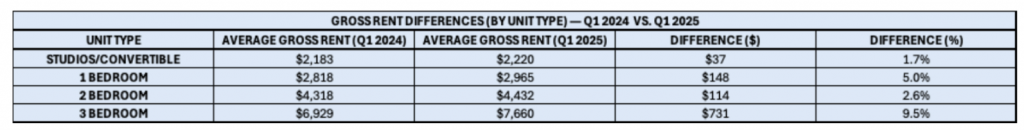
All unit types showed year-over-year growth, with 1 bedroom apartments leading the way with a sizable increase of 5.0% or +$148. 1-bedroom apartments accounted for 50% of the total rentals in Q1 2025, so a significant portion of the collective YoY rent growth came from this one unit type.
The average SF for 1 bedroom apartments was comparable—741 SF in 2024 and 745 SF in 2025—which helps illustrate the genuine growth.
Studios/convertibles achieved a modest growth of 1.7%. This unit type has a rent ceiling, as nearly all of these units will be occupied by single renters with single incomes. These units will continue to increase at the slowest rate due to income qualification restrictions.
The average SF for studios/convertibles were also comparable—545 SF in 2024 and 541 SF in 2024—down slightly YoY.
Two bedroom units experienced solid YoY rent growth of 2.6%—in line with expectations for this unit type and its core demographic. Renters of 2 bedroom units tend to be slightly older, dual-income couples who typically view renting as a transitional step toward homeownership. However, with elevated interest rates and a lack of for-sale inventory, many renters in this segment are remaining in the rental market longer than expected.
Reflection — Rent Growth Outpacing Income Growth
In the Q4 2024 Chicago Class A Multifamily Market Update, we projected that rent growth could begin to outpace income growth—a trend now materializing in the 1 bedroom segment. Comparing the average 1 bedroom rent for 2024 to Q1 2025, there is a 5.7% increase. Based on the standard 3x rent-to-income qualification ratio, renters now need to earn approximately $107,000 per year to qualify for these units, compared to $101,000 in 2024.
If this trajectory continues across 1 bedrooms and other unit types, it could drive more renters to seek value in adjacent neighborhoods. Submarkets like Wicker Park, Lakeview, and Logan Square—where Class A supply is more limited—may experience stronger-than-anticipated rent growth as affordability concerns redirect demand.
At Luxury Living, we not only provide data, but analyze the data to help inform developers and capital partners to make the best decisions on pricing strategy, unit mix, and amenity programming.
Click Here to Download our Q1 2025 Chicago Class A Multifamily Market Update