Chicago Class A Multifamily Market Update — YoY July 2025 Rental Data

Luxury Living consistently tracks leasing data on larger assets in Downtown Chicago’s Class A Market built since 2016. This dataset currently includes 85 properties and over 27,500 total units—and counting. These properties set the tone for the entire market.
Supply constraints in Chicago’s multifamily market are driving notable fluctuations in availability and pricing. Since January 1, 2025, available units have declined by 37.8%, dropping from 2,649 in the first week of 2025 to 1,647, as of August 11, 2025.
The vast majority of properties continued to stay above 96% leased in July, with a sizable group of properties at 99% leased and very little exposure. High-retention, historically low supply and increased demand is leading to all-time occupancy percentages in Q4 2025 for the upper-end properties in Chicago.
Now let’s dig in to see how this happened.
The tables below show YoY data by unit type for July 2024 and July 2025 for the most common unit types: Studios through 2 bedrooms, which historically represent more than 97% of units leased.
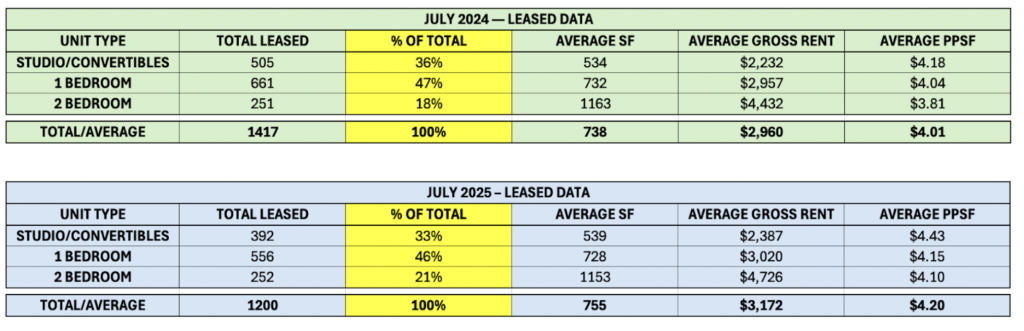
July had an unprecedented 15.3% drop in absorption in 2025 compared to 2024, continuing the trend of YoY decreases in total monthly rentals starting in May. This marks the third month in a row with double-digit-percentage declines in monthly absorption, and will likely continue through the end of the year due to ultra-limited supply in Chicago.
As a percentage of total rentals:
This is extremely abnormal, but does explain the massive 7.2% growth year-over-year rent growth, as the 2 bedroom total remained consistent, while there was a 218-unit reduction in studios/convertibles and 1 bedroom rentals.
The higher share of 2 bedroom rentals caused average SF to rise 2.3%, which historically would negatively impact and gross PPSF. Not this year:
2025 Trend:
Older assets (built 2016–2021) that previously competed with lease-ups offering deep concessions are emerging as some of the market’s biggest winners. To stay competitive, these properties held rents flat and even offered $0 renewal increases. Now, after 2–3 years of rent suppression, they are capitalizing on significant tradeout potential, and the gains have been substantial.
While this surge will eventually level off, it doesn’t diminish the remarkable year-over-year rent growth achieved. Chicago’s persistent supply constraints are enabling these older assets to catch up, raising the floor for gross rents. The ultimate ceiling, however, remains to be determined as affordability and income qualification needs to be considered.
Overall averages paint a clear picture of YoY rent growth. However, there are important nuances when analyzing data at a submarket level, and even more nuanced when looking at the unit-type level.
Average SF — By Submarket — Studios through 2 Bedrooms
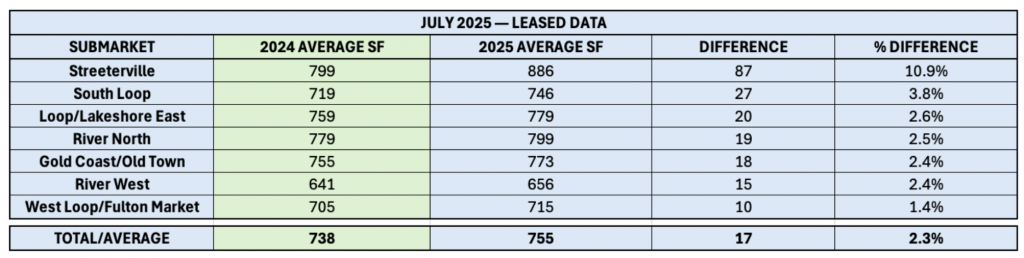
Seasonality historically plays a significant role in average SF. As rents rise during the prime leasing months, average SF tends to drop due to rising rents. For example, renters who can afford a 1 bedroom in January and February, potentially end up leasing a convertible during the prime season due to affordability and income qualification.
Due to the limited lease-ups, there was a significant gap in availability for these unit types, and 2 bedrooms had a greater market share of total rentals.
Average Gross Rent — By Submarket — Studios through 2 Bedrooms
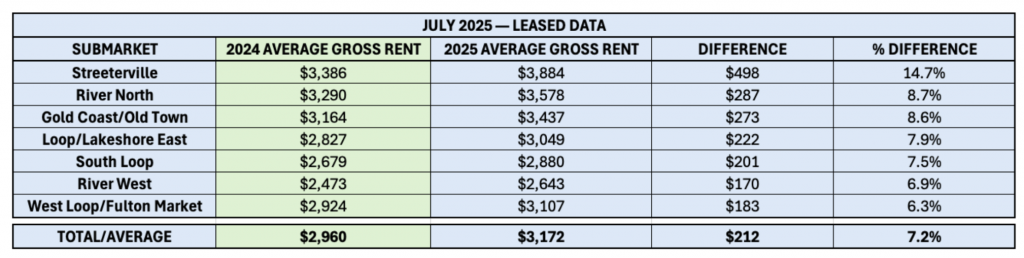
While the raw numbers are real, looking into the reasons why is critical to understanding fluctuations in the market. The proportion of 2 bedroom rentals is having a direct impact on the overall numbers.
Reviewing the leased data down to the unit type will illustrate this even further.
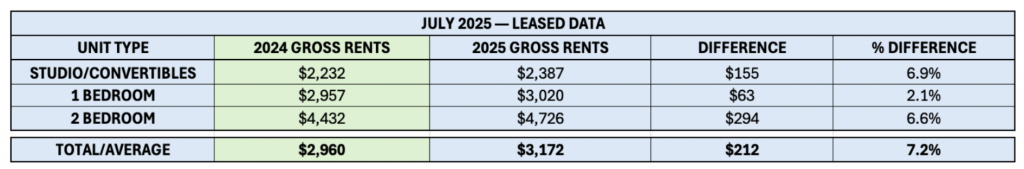
Studios/convertibles and 2 bedrooms posted the strongest YoY gains in July 2025, rising 6.9% and 6.6%, respectively. Much of this growth stems from older assets with previously suppressed rents bringing pricing back to market.
When this is segmented down to only studios/convertibles and 1 bedrooms, which represented nearly 80% of the total rentals, the combined gross rent increase was 4.4%.
Newer properties that leased up over the past two years also saw rent growth, though closer to 3%, while many still required concessions to compete.
1 bedrooms have led the market with the highest rent growth and have maintained strong momentum in the first half of 2025, with rents increasing 4.5%. By July 2024, this unit type had already approached its ceiling, which explains the more moderate YoY growth observed now.
The current market correction will continue through the remainder of 2025 and into June 2026, with Chicago’s multifamily floor steadily rising before eventually leveling off. Identifying the true drivers of these increases is essential to avoid overcommitting to prevailing narratives.
We will revisit the data in August, but current trends suggest that ongoing supply constraints will keep driving notable fluctuations in multifamily performance. For now, the volatility favors landlords, creating opportunities for strategic pricing and retention gains.
Luxury Living is here to help you in all aspects of multifamily development. From pre-development consulting to marketing and leasing, we are Chicago’s multifamily leasing expert.