Chicago Class A Multifamily Market Update — Updated July 2024
Luxury Living consistently tracks leasing data on larger assets in Downtown Chicago’s Class A Market built after 2016. This dataset currently includes 83 properties and over 27,000 total units—and counting. These properties set the tone for the entire market.
Tracking leased rentals as opposed to available units (asking rents) shows what is really happening in Chicago multifamily.
The total rental volume increased by a staggering 46% in Q2 2024 compared to Q2 2023. The downtown Chicago Class A market leased over 5,000 units in Q2 2024.
This increase is primarily due to the amount of lease-ups that launched during the second half of 2023 through Q2 2024, all of which had heavy volume in this most recent quarter.
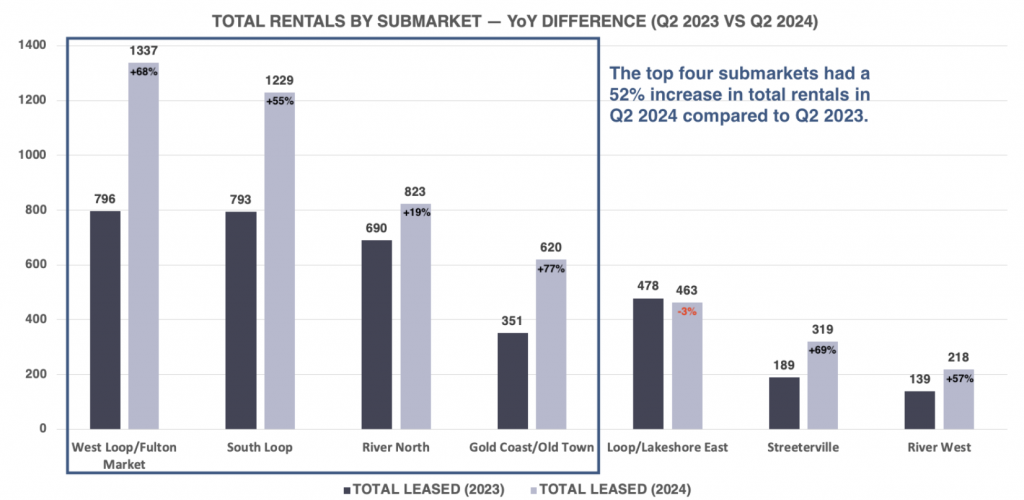
For the last several years, West Loop/Fulton Market, South Loop and River North were considered “The Big Three,” but due to two lease-ups commencing in Gold Coast/Old Town, adding nearly 700 total units, this submarket skyrocketed 77% from Q2 2023.
West Loop/Fulton Market had a very strong showing, increasing its volume of rentals 68% from Q2 2023, and South Loop wasn’t far behind, increasing 55% YoY.
Streeterville doesn’t appear as dominant due to only showing 319 total rentals, but an increase of 69% is very impressive. The lone Streeterville lease-up in Q2 2024 contributed 35% of the total rentals to this submarket.
Overall, the full market increased by an average of 46% from Q2 2023, which is an increase of 1,573 rentals in one quarter.
There was a huge spike in total rentals from Q2 2023 to Q2 2024. What caused it?
March kicks off the leasing season in Chicago, which historically lasts until mid-August. This 6-month period is the most important period of time for Chicago multifamily. It is when the city achieves the highest gross rents, highest gross PPSF, and by far the highest volume of rentals.
To revisit the data from March 2024, there were 1,447 total rentals, which was a 69.2% increase over February 2024 (855), further illustrating why March kicks off the season.
The graph below is showing the continued upward growth from March, highlighting the quarterly increases per month.
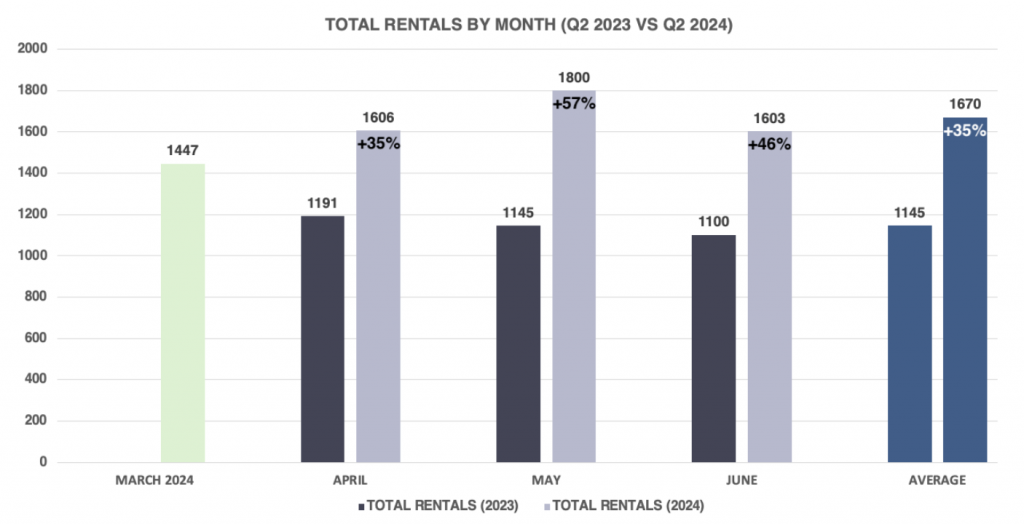
The real story is in May, which topped off at 1,800 total rentals, exceeding May 2023 by 57%. It dipped a bit in June, nearly matching April’s total, but was still 46% higher than June 2023. May is usually the busiest leasing month.
Fast forwarding to Q2 2025, these numbers are going to drop significantly due to the lack of lease-ups commencing over the next 18 months. Based on these absorption numbers, demand will far outpace supply in 2025 and 2026, when there are no new material deliveries.
With thousands of new units approved for zoning and seeking capitalization, the question remains: Are properties optimized to meet the market demand?
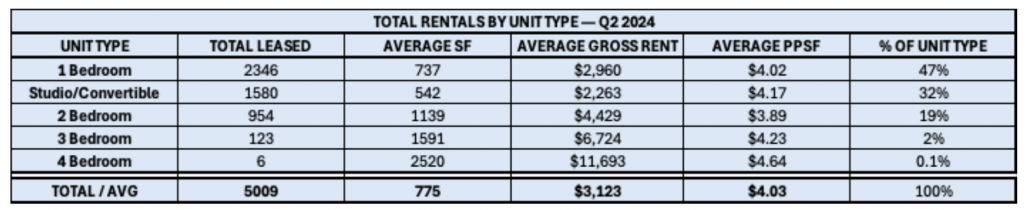
One of the most important trends that we track is the percentage of unit types absorbed by the market. With average SF relatively stable, rents for certain unit types are becoming less and less affordable as rents continue to rise. This trend is causing a slight shift downward in 1 bedroom and 2 bedroom rentals, as a percentage of the total.
Another factor is zoning requirements providing increased density in the total percentage of efficiency units built, which is adding more studios and convertibles to the market.
In Q2 2024, 78% of the total rentals were studios, convertibles and 1 bedrooms. That is spotlighting market demand. There will always be a need for 2 bedrooms, but as those rents continue to rise, that unit type is becoming less affordable. Even concessions cannot offset a unit mix that isn’t optimized for the market.
The average SF for the total rentals in Q2 2024 was 775, which is only a difference of 8 feet higher than Q2 2023 (when it was 767 SF). When the average SF is this close, it makes comparing gross rents that much more compelling.
The graph below illustrates SF variance from Q2 2023 to Q2 2024 by submarket.
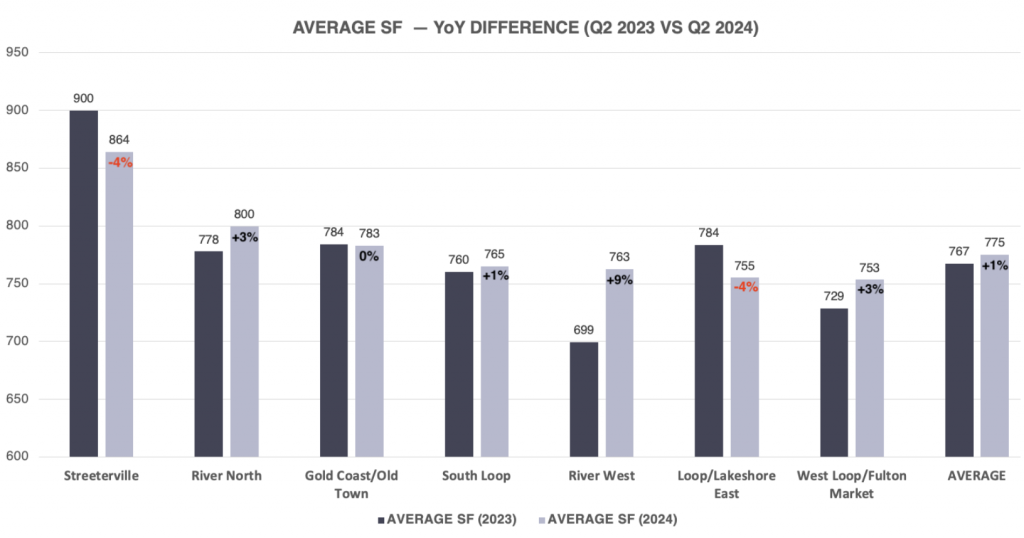
Two submarkets showed decreases in average SF from Q2 2023. Most notably, Streeterville. Over the last several years, Streeterville has led all submarkets in average SF due to fewer studios and convertibles and a heavier mix of larger 1, 2 and 3 bedrooms compared to the other submarkets.
The lone lease-up in Streeterville, which contributed to 35% of the total rentals in Q2 2024, had an average SF of 752, which lowered the traditionally 900+ SF average in this submarket into the mid-800s.
River North and West Loop/Fulton Market both had an average increase of 3%, which is within normal fluctuations. However, West Loop/Fulton Market, with a myriad of brand-new properties, still has the smallest average SF of any submarket in Chicago.
River West had a significant increase of 9%. This increase is due to a much higher percentage of 2 and 3 bedroom rentals, which equated to 36% of the rentals in the submarket. In Q2 2023, this number was only 21%.
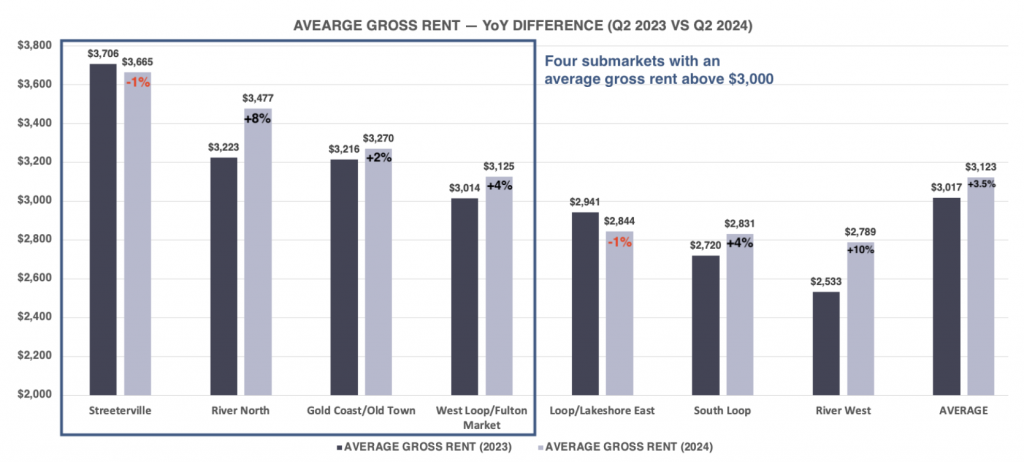
The average gross rent for the full market topped $3,100 for the quarter (+3.5%), and knowing that the average SF is only 8 SF higher, SF is not skewing that data.
The YoY data for Q1 2024 showed an average gross rent increase of 3%, and this continues the upward trend with an impressive 3.5% increase in Q2 2024 over Q2 2023.
River North was among the submarkets with the highest increases. It is still considered one of the most desirable submarkets, and stabilized leasing efforts had a strong showing. There was one premium lease-up that contributed 11% of the total rentals for the quarter, with average rents pushing $3,400 / $4.41 PSF. However you slice it, +8% rent growth in River North is impressive.
West Loop/Fulton Market and South Loop both had gross rent increases of 4%, which is due to the premium lease-ups that dominated the submarkets.
River West’s 10% increase can be attributed to the previously mentioned percentage of 2 and 3 bedroom rentals, which increased average gross rents. And the 1% decrease in Streeterville can be attributed to the lease-up, which has a significantly smaller average SF. Context is key.
The narrative of Chicago continuing to lead the nation in rent growth continues.
At Luxury Living, we not only provide data, but analyze the data to help inform developers and capital partners to make the best decisions on pricing strategy, unit mix, and amenity programming.
Click Here to Download our Q2 2024 Chicago Class A Multifamily Market Update
Luxury Living is here to help you in all aspects of multifamily development. From pre-development consulting to marketing and leasing, we are Chicago’s multifamily leasing expert.