Chicago Class A Multifamily Market Update — Updated January 2025
Luxury Living consistently tracks leasing data on larger assets in Downtown Chicago’s Class A Market built after 2016. This dataset currently includes 84 properties and over 27,500 total units—and counting. These properties set the tone for the entire market.
Tracking leased rentals as opposed to available units (asking rents) shows what is really happening in Chicago multifamily.
The downtown Chicago Class A market absorbed nearly 2,500 units in Q4 2024, a 27% increase from Q4 2023.
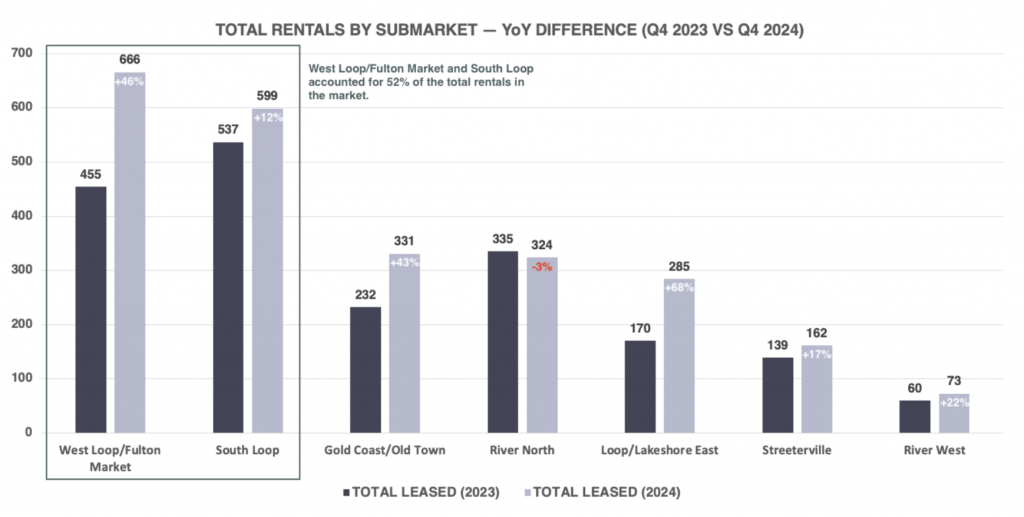
West Loop/Fulton Market and South Loop are the two submarkets with the most available inventory due to several ongoing lease-ups in 2024. As a result, more than half of the total rentals in the market in Q4 occurred in these two submarkets.
Gold Coast/Old Town has two large-scale lease-ups that added much-needed inventory. In turn, it created an uptick in volume 43% higher than Q4 2023.
River North was slightly down (-3%) compared to Q4 2023 due to a fully stabilized market in Q4 2024.
Loop/Lakeshore East had the largest increase in overall volume (+68%) due to an abnormally slow quarter in Q4 2023, when the Loop was still slowly recovering from the pandemic.
The 512-unit increase in total rentals during the slowest quarter of the year demonstrates that Chicago urgently needs more inventory.
The average PPSF in Q4 2024 was up 2.5% compared to Q4 2023. Several high-quality lease-ups coupled with less inventory in stabilized properties created solid growth.
At $3.81 PSF, the average PPSF is down nearly 6% from a peak in Q2 2024 when the market reached $4.03 PSF. This rent decrease is expected due to seasonality, but seeing an increase in Q4 2023 vs Q4 2024 is promising.
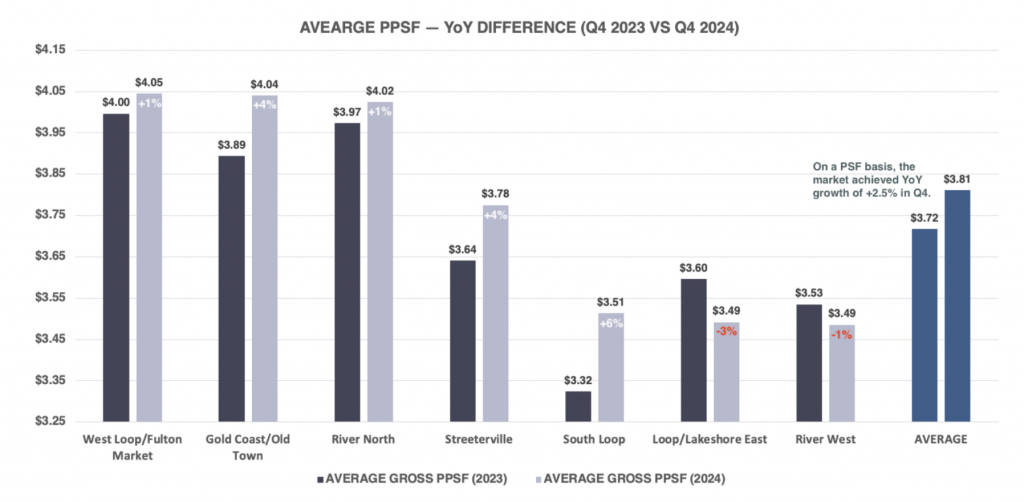
The biggest movers were Gold Coast/Old Town and Streeterville at +4%, respectively, and South Loop at a significant +6% compared to last year.
Three submarkets exceeded $4.00 PSF in Q4 2024, which is extremely impressive considering seasonality in Chicago.
Looking into the future: Based on the high absorption typically seen in Q2 and Q3, it’s more than likely the market will average $4.00 PSF or higher in 2025.
Two submarkets—Loop/Lakeshore East and River West—saw declines of -3% and -1%, respectively.
Average square footage plays a significant role in average PPSF. Generally, a lower average SF will result in a higher PPSF if the rents are comparable.
Comparing Q4 2023 to Q4 2024, many submarkets have sizable differences.
The most important connection in the graph below is the average PPSF by submarket as it relates to the average SF.
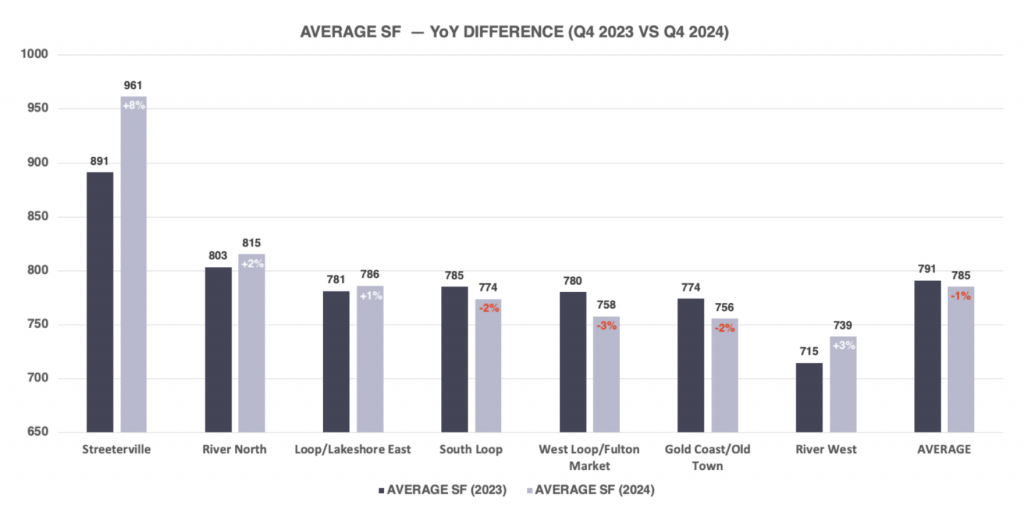
When average square footage is directly compared to the average PPSF, it’s easy to see how insights can be skewed without this critical data point.
However, the market as a whole was only down an average of 6 SF, so the growth from $3.72 PSF to $3.81 PSF is pure.
Most notably, the average SF rose significantly in Streeterville—891 SF to 961 SF (+8%)—while the average PPSF rose +4%, from $3.64 to $3.78. The larger inventory in Streeterville is among the most desirable in the city, with views of the skyline and the lake. With those x-factor premiums, the PPSF for units 900 SF and higher was $3.77 PSF, while for units smaller than 900 SF were $3.79 PSF. That shows the power of view premiums in larger units, which are not realized nearly as much as in other submarkets.
This trend is likely driven by would-be buyers—typically older with higher incomes—forced to stay in the rental market. The data suggests this is likely the case as the age of first-time homebuyers continues to rise.
Loop/Lakeshore East requires additional insight into volume, average SF, and average PPSF.
The average increase in volume in Q4 2024 was significant, rising +68%, while the average PPSF had the biggest decline (-3%). The average SF was nearly even, only up by 5 SF.
Exposure for these properties began to increase significantly in late Q3 2024 and rents needed to adjust to compete for renters. The increase in exposure was largely driven by a larger percentage of students not renewing in many of these properties. So much so that 37% of the total rentals had a staggeringly low gross PPSF of $3.25 or lower. Only 22% of the total rentals exceeded $4.00 PSF. The top of the market did not have enough weight to carry the lowest-performing inventory, resulting in a steep decline in PPSF.
Even though the volume was up significantly, the rents were heavily depressed to compete for renters and combat exposure and vacancies heading into the slowest leasing season of the year. The students returned in Q4 but at lower prices than the rest of the market.
In a healthy market, year-over-year rent growth is expected, regardless of the time of year. When comparing Q4 2023 to Q4 2024, gross rents increased +1.8%, rising from $2,941 to $2,993.
How did the individual unit types perform?
The below table is showing the rent differences by unit type from Q4 2023 to Q4 2024:
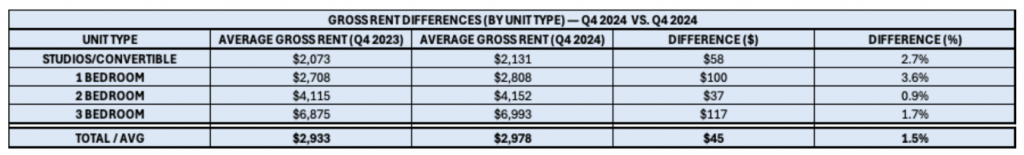
All unit types showed year-over-year growth, with 1 bedroom apartments leading the way with a sizable increase of 3.6%. 1 bedroom apartments account for half of the total rentals in the market each year, and that kind of demand can lead to much higher rents in a strong market.
The average SF for 1 bedroom apartments was comparable—739 SF in 2023 and 733 SF in 2024—which helps illustrate the genuine growth.
Studios/convertibles also achieved a significant increase of nearly 3%. This unit type typically trails 1 bedroom apartment growth. As 1 bedrooms become less affordable, more and more renters will opt for a studio or convertible due to affordability vs. necessity.
Average SF rose 12 SF for these unit types—537 SF in 2023 and 549 SF in 2024. Expect to see the most growth for convertibles and studios in 2025 as rents continue to rise.
2 bedroom units experienced a modest growth of just under 1%, which aligns with typical seasonal trends. Demand for 2 bedroom apartments tends to be softer in Q4, reflecting a recurring pattern in the market.
What to watch for in 2025 — Rent growth outpacing income growth. Income qualification is still a critical component to absorption in Chicago.
In 2024, the average income required to qualify for a 1 bedroom apartment was just over $101,000. This is expected to rise significantly over the coming years.
At Luxury Living, we not only provide data, but analyze the data to help inform developers and capital partners to make the best decisions on pricing strategy, unit mix, and amenity programming.
Click Here to Download our Q4 2024 Chicago Class A Multifamily Market Update
Luxury Living is here to help you in all aspects of multifamily development. From pre-development consulting to marketing and leasing, we are Chicago’s multifamily leasing expert.