
Luxury Living consistently tracks leasing data on larger assets in Downtown Chicago’s Class A Market built after 2016. This dataset currently includes 78 properties and over 26,000 total units—and counting. These properties set the tone for the entire market.
Tracking leased rentals as opposed to available units (asking rents) shows what is actually happening in Chicago multifamily.
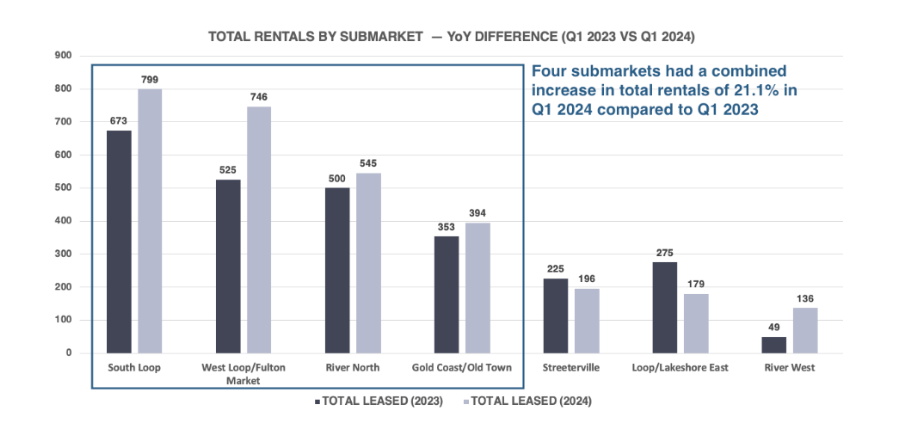
The total rental volume increased by 15.2% in Q1 2024 compared to Q1 2023.
While lease-ups commenced in Q1 2023, several were pre-leasing and had no occupancy in this quarter. Fast forward to 2024—those properties are continuing to lease, but an additional nine lease-ups are adding more volume at a faster pace.

The big three—South Loop, West Loop/Fulton Market, and River North—accounted for nearly 70% of the total rentals.
There were nearly 3,000 rentals in Q1 2024 compared to 2,600 in Q1 2023. This is a healthy jump when Q1 continues to feel the drag of seasonality.
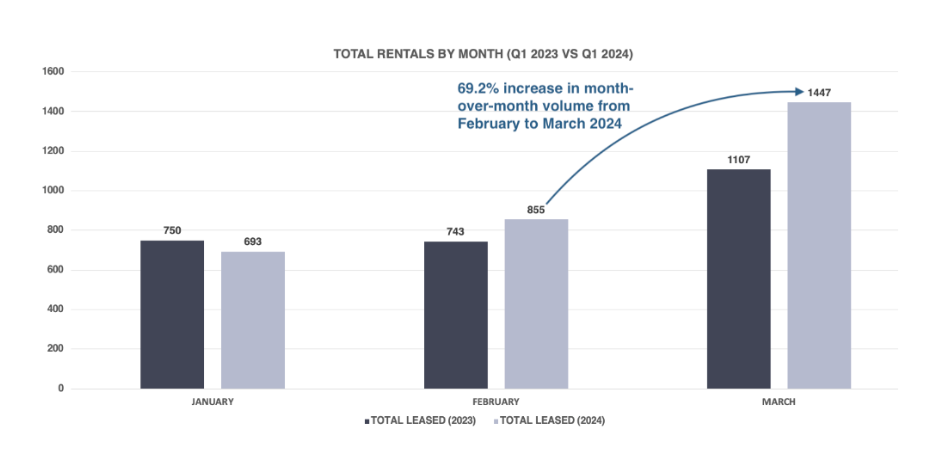
Speaking of seasonality, January and February are more associated with November and December, while March officially marks the beginning of what we call “Thrive Season.” This is the first of the busiest months of leasing in Chicago—March through August.

The total rental volume has increased substantially from February to March for both of the last two years. In 2023, the jump from February to March was a robust 49%, while the increase in 2024 for the same period was 69.2%. This is a huge difference YoY.

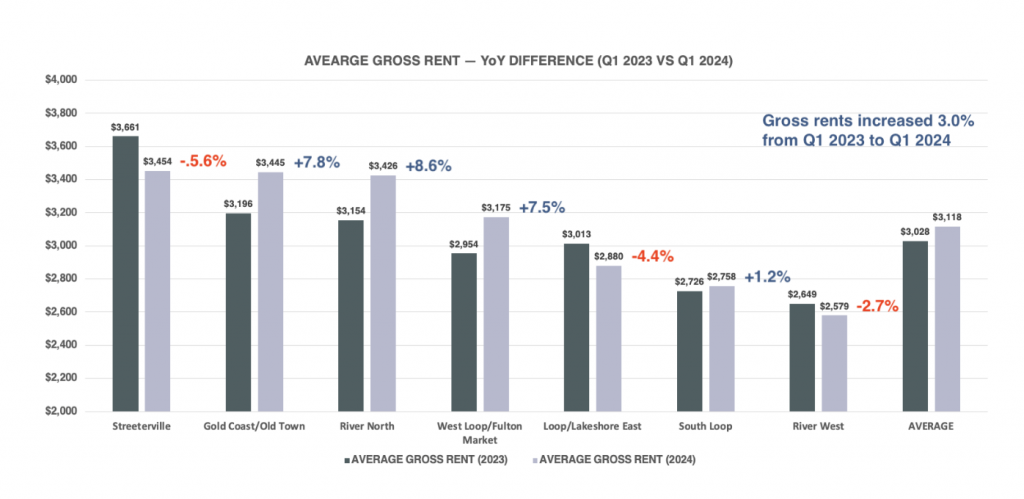
This group of properties saw a healthy overall increase in gross rent of 3.0% when compared to Q1 2023. However, growth is inconsistent from submarket to submarket for various reasons:
Streeterville shows a 5.6% decrease in gross rents. The primary driver for this is average SF, which is the one variable that will continue to impact year-over-year rent growth. The average SF for Streeterville in Q1 2023 was 951, while for the same period in 2024, it dropped to 882, a 7.8% decrease. Smaller average SF will lead to lower rents, but it’s nothing to be surprised about when you have context.
The SF variance was a similar dynamic in River North, where the average SF in Q1 2023 was 769, while in Q1 2024 it rose to 833 (+8.3%). This is nearly identical to the average gross rent increase of 8.6%, but also contributed to a lower gross PPSF year-over-year due to the larger average SF. SF and PPSF have an inverse relationship; the larger the SF, the lower the PPSF.
Overall, the average gross rent increased from $3,028 to $3,118. This period marks the first time we have seen average rents across these properties higher than $3,100.
The narrative of Chicago continuing to lead the nation in rent growth continues.
West Loop/Fulton Market continues to be the most active multifamily market in Chicago. In 2024, 22 properties are being tracked in the West Loop/Fulton Market, several of which are premier lease-ups. Even though the gross rent increased a sizable 7.5%, it still felt low considering the quality of the new deliveries and the high rents achieved in this submarket in 2023 and 2024.
The influx of high-end inventory caused a ripple effect for the older, shorter, less-amenitized properties, which still needed to compete for renters.
When only looking at assets delivered from 2016 – 2022, rents decreased for 10 of the 13 properties, and there was only a combined gross rent increase of 1.3%.

Furthermore, these properties comprised 65% and 57% of the rental volume in Q1 2023 and Q1 2024, respectively. These slightly older/shorter properties prevented the submarket’s rent growth from exceeding 10%.
Here’s the most compelling data point: When only considering 2023 and 2024 West Loop/Fulton Market lease-ups, the average rent is $3,581, nearly $600 higher than the 13 properties in the above data set.
Historically, the only thing holding gross rents back for West Loop/Fulton Market was building height and view premiums, which have always helped drive higher rents in submarkets like River North and Streeterville. As the newer properties grow taller, so do the rent premiums. When this was once a $2,800 submarket, the average rent in West Loop/Fulton Market is approaching $3,200, a 14% increase.
At Luxury Living, we not only provide data, but analyze the data to help inform developers and capital partners to make the best decisions on pricing strategy, unit mix, and amenity programming.
Click Here to Download our Q1 Chicago Class A Multifamily Market Update
Luxury Living is here to help you in all aspects of multifamily development. From pre-development consulting to marketing and leasing, we are Chicago’s multifamily leasing expert.