

Luxury Living consistently tracks leasing data on larger assets in Downtown Chicago’s Class A Market built after 2016. This dataset currently includes ≈60 properties and just over 22,000 total units. These properties set the tone for the entire market.
Tracking leased rentals as opposed to available units (asking rents) shows what is actually happening in Chicago multifamily. Furthermore, showing how the average gross rents compare to the average SF is equally important, as PPSF has a major impact on how a property is perceived in the market.
As expected, lease volume in Q4 decreased significantly from ≈2300 leases in Q3 to ≈1700 leases.
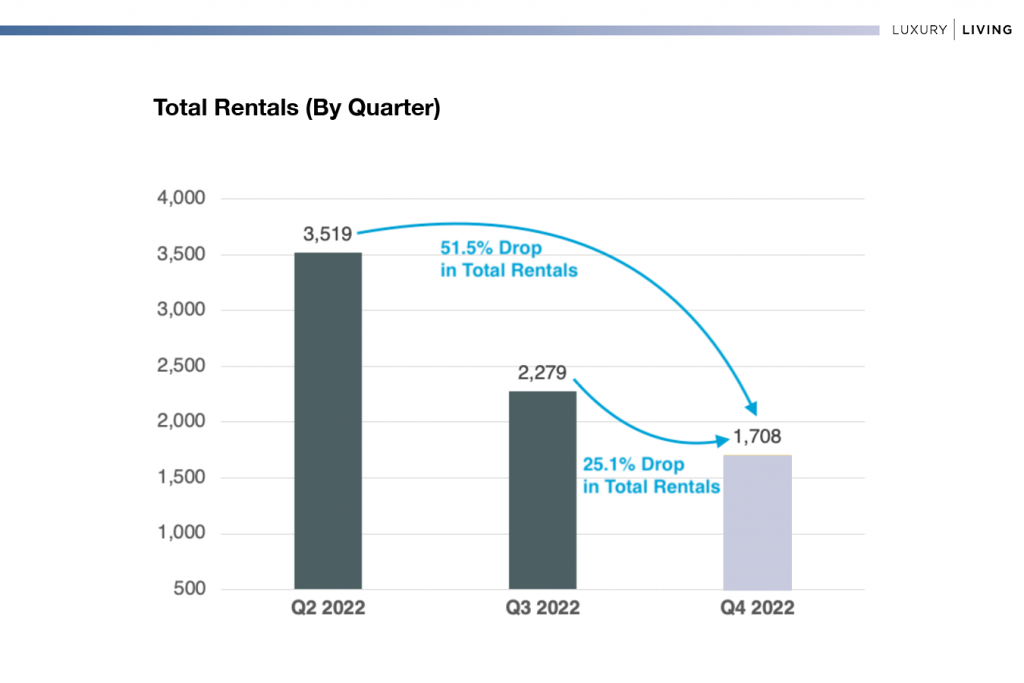
Despite the 25% reduction in total rentals from Q3 to Q4, this was 10% less of a reduction as compared to the decrease from Q2 to Q3, where the volume of rentals decreased 35% quarter over quarter. In the last two quarters, the amount of leases has dropped a combined 60%. In other words, the amount of volume in Q2 (the most active time of the year) compared to Q3 and Q4 is substantial.
Seasonality impacts Chicago apartment velocity as much as any city in the country.
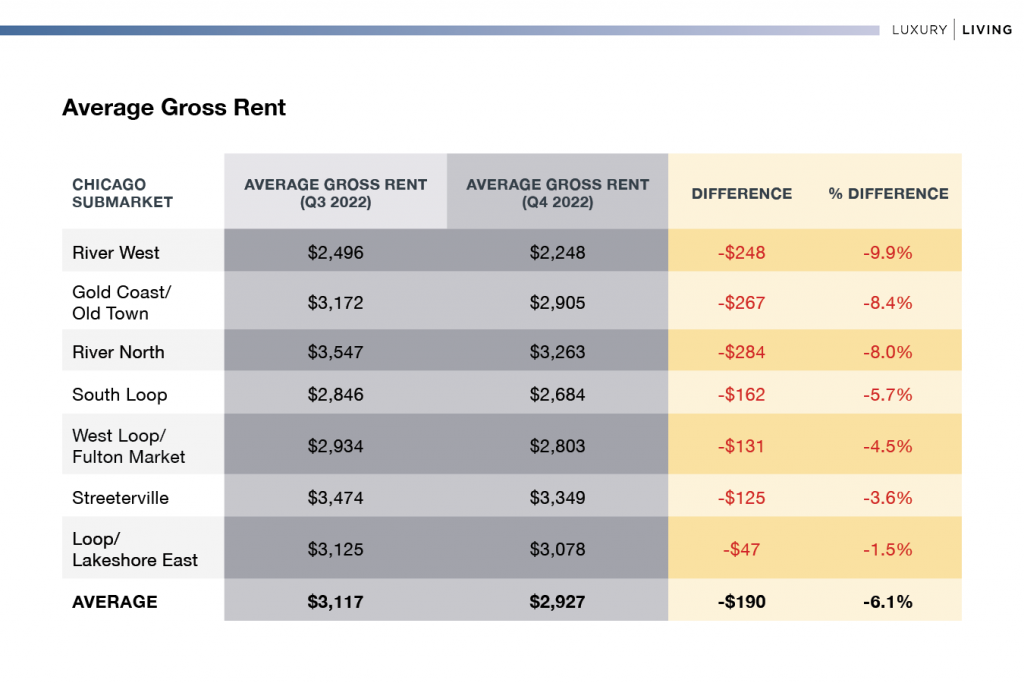
Considering the reduction in total rentals, average gross rents only decreased by 6.1%. Historically speaking, this is less of a decrease than we typically see in Q4.
Higher gross rents were able to be achieved because of higher occupancy. The average occupancy for this dataset was ≈94%. This allowed leasing/management teams to limit significant reductions in rent while maintaining occupancy. Minimal new deliveries in 2022 helped boost occupancy on stabilized properties. This trend should continue in Q1–2023.
Average gross rents decreased in all seven downtown submarkets in Q4. The below table shows the variance in average gross rent from Q3 to Q4 by neighborhood submarket.
Average Gross Rent
Average Square Footage
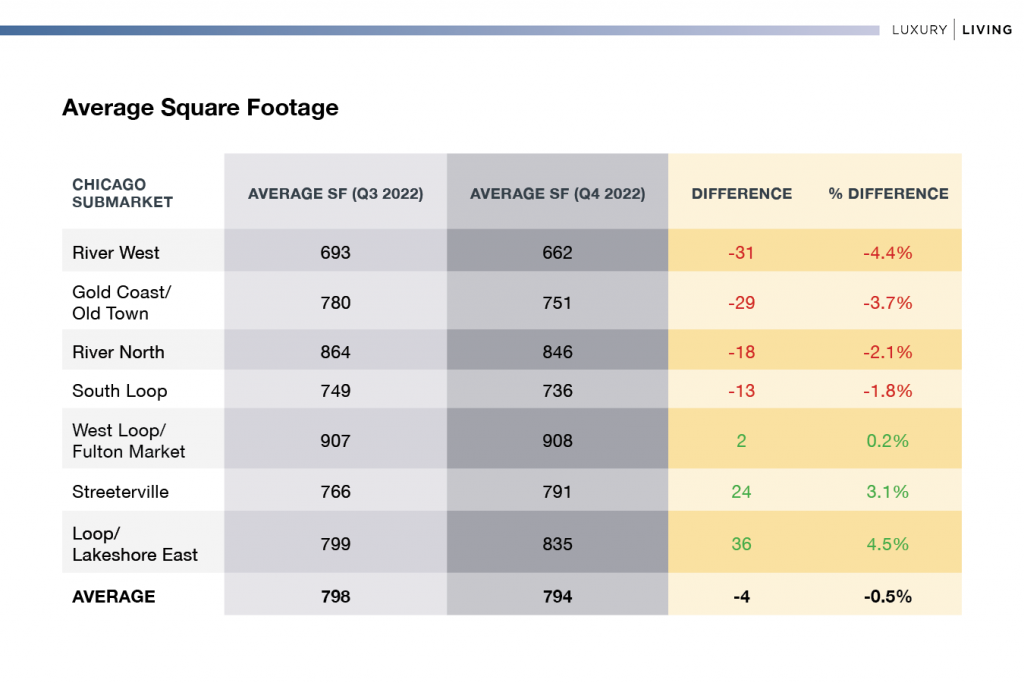
The average SF in Q4 remained very consistent compared to Q3. The largest decrease in average SF was River West (-31 SF) and the largest increase was Loop/Lakeshore East (+36 SF). Square footage variance compared to Q3 was immaterial.
Overall, the average SF was only down 4 SF (-0.5%).
While the average SF did not vary from Q3, renters were able to get more bang for their buck in Q4 in select submarkets.
The South Loop is a prime example. Renters were able to lease an apartment that was 24 SF larger while paying $162 less in rent.
West Loop/Fulton Market renters leased nearly identical inventory (-13 SF) at a $131 discount (-4.5%).
This is purely a factor of seasonality in Chicago, and why optimizing the lease-expiration schedule is one of the most important aspects of managing a Chicago Class A multifamily property.
One Bedrooms Continue to Dominate
One-bedroom rentals have remained steady over the years, generally making up 45 to 50% of all rentals annually. Q4 was no different:
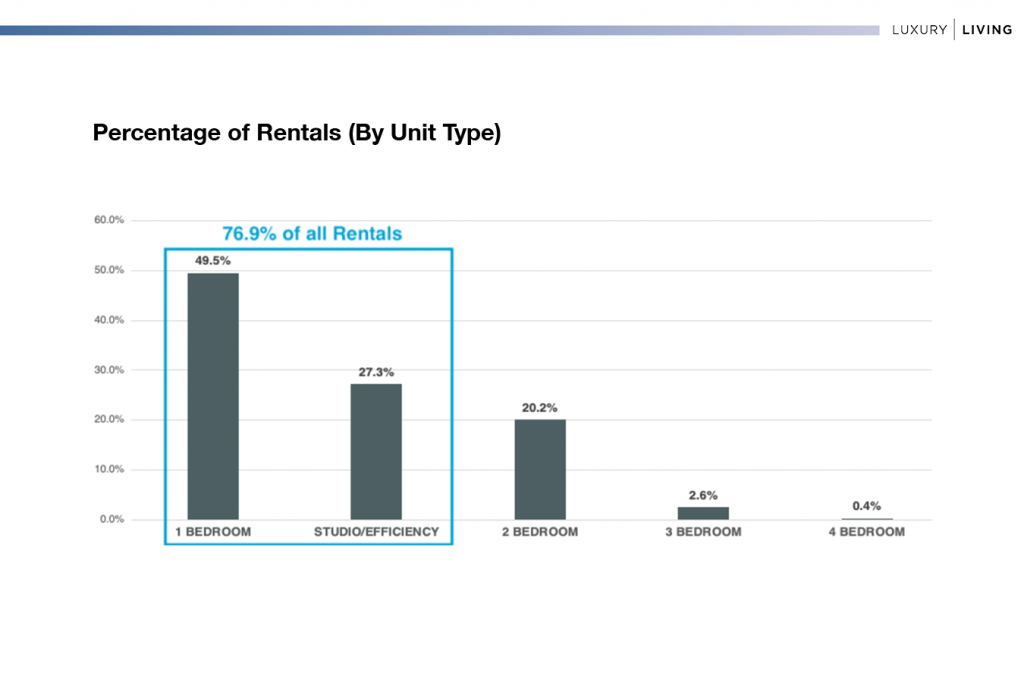
Studios/efficiencies continue to increase in demand, making up 27.3% of the total rentals in Q4. As gross rents continue to increase, this unit type will be more in demand based on income qualification.
A single renter would need to make $24,747 more per year to qualify for the average 1 bedroom ($2,739) compared to the average studio/convertible ($2,051).
At Luxury Living, we not only provide data, but analyze the data to help inform developers and capital partners to make the best decisions on pricing strategy, unit mix, and amenity programming.
Click Here to Download our Q4 Chicago Class A Multifamily Market Update
Luxury Living is here to help you in all aspects of multifamily development. From pre-development consulting to marketing and leasing, we are Chicago’s multifamily leasing expert.