Chicago Class A Multifamily Market Update — Q2 2025

Luxury Living consistently tracks leasing data on larger assets in Downtown Chicago’s Class A Market delivered since 2016. This dataset currently includes 85 properties and over 27,500 total units—and counting. These properties set the tone for the entire market.
Tracking leased rentals, as opposed to available units (asking rents), shows what is really happening in the Chicago multifamily market.
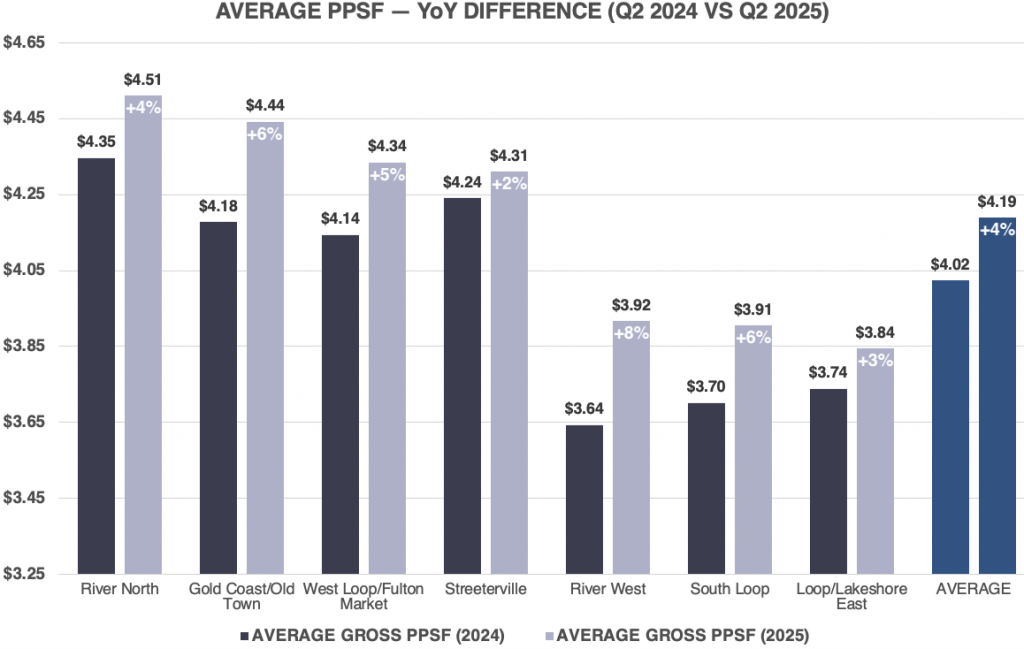
The average PPSF in Q2 2025 was up 4.1% compared to Q2 2024.
All submarkets combined achieved an impressive $4.19 PSF, with four of the seven submarkets above $4.30 PSF.
This growth is directly tied to extremely limited supply, prompting revenue management systems to push rents in an effort to test the upper limits of renter tolerance. However, absorption is beginning to slow, leading to rising exposure rates across several submarkets. Rents have likely reached their peak for the year, and many renters are being increasingly priced out of the market.
Several submarkets outpaced the citywide average:
In the Q1 2025 Chicago Class A Multifamily Market Update, we noted, “Loop/Lakeshore East was the only submarket to decline, dropping -2% to $3.58 PPSF. Despite strong absorption volumes in the area, it’s likely the properties in this set had not yet responded to the overall demand for select unit types. We predict this will shift to positive growth in Q2 2025.”
Loop/Lakeshore East saw a 3% increase in Q2 2025 compared to Q2 2024, rising from $2,829 to $2,911, indicating owners and operators responded appropriately to heightened demand at this coveted price point. This submarket remains affordable relative to other submarkets downtown, second only to River West, which averaged $2,804.
We anticipate continued growth through the end of 2025, but seasonality may prevent it from closing the 6% rent gap between the next highest-performing submarket (South Loop).
Average square footage is a key data point that provides essential context for interpreting gross PPSF. The graph below highlights the year-over-year differences in average square footage across each submarket.
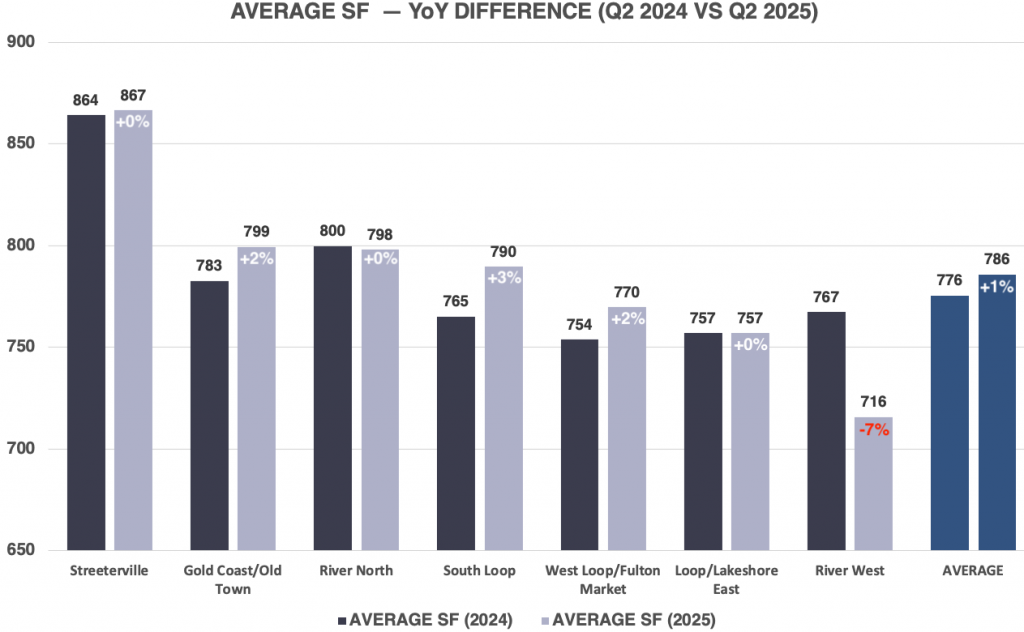
In Q2 2025, average gross rents rose by 5.6%, while average square footage increased nearly 2%, indicating heightened demand for larger unit types.
Although it may seem immaterial, 3 and 4-bedroom units accounted for 0.7% more of total rentals in Q2 2025 compared to Q2 2024. While these unit types represent only about 3% of total annual rentals, their average size of over 1,600 SF with gross rents exceeding $7,000 can meaningfully impact overall rent and square footage averages.
Additionally, 2 bedroom rentals increased by 1% year-over-year. Collectively, the larger unit types had a material impact on overall average square footage and in turn, contributed significantly to the rise in gross rents for Q2 2025.
Take River West, for example: while PPSF increased 8% year-over-year, the average square footage declined by nearly 7%—a critical metric for understanding such a sharp rise in PPSF.
South Loop recorded the largest increase in average unit size, rising from 765 SF to 790 SF (+3.2%). Even more impressive, gross PPSF in the submarket rose by 6% despite the gain in square footage—a rare combination. It’s worth noting that 65% of 3 and 4-bedroom rentals in the South Loop were located on floors 50 and above, contributing to this premium.
Gold Coast/Old Town and West Loop/Fulton Market also saw average square footage increase by 2.1% year-over-year. Both submarkets posted rent growth as well, with PPSF up 6% and 5%, respectively. When both square footage and PPSF rise concurrently, it signals the most favorable conditions for revenue growth.
West Loop/Fulton Market had the highest concentration of concessions in the market in Q2 2025, which allows gross rents to increase while still maintaining a semblance of affordability.
The collective year-over-year increase in 2 bedroom through 4 bedroom rentals had a significant impact on gross rents.
Gross rents in Q2 2025 rose 5.4% compared to Q2 2024, rising from $3,121 up to $3,295.
The table below shows year-over-year data by unit type for Q2 2024 and Q2 2025, focused on studios through 2 bedrooms. These unit types account for 97% of all rentals annually, making them the most representative for analyzing overall market performance.
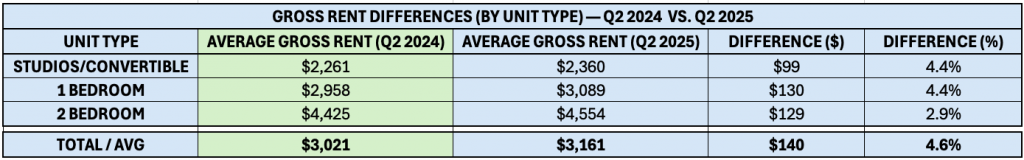
For 97% of the rentals in Q2 2025, the average gross rent increased from $3,021 to $3,161, resulting in a still impressive 4.6% increase, but a difference of nearly 1% from the headline increase when including 3 and 4 bedroom units.
Despite accounting for only about 3% of total rentals annually, 3 and 4 bedroom units carry significantly higher rents and square footage, which can have an outsized impact on overall gross rent figures.
While none of the individual unit types saw rent growth above 4.4%, the overall average increased by 4.6% due to the weighted impact of higher-rent units like 1 and 2 bedrooms. With 1 bedroom rentals making up nearly half of all rentals and seeing the largest dollar increase, even a slight shift in volume was enough to move the total average higher.
The upward shift in studio/convertible rents at +4.2%, which matched the increase on 1 bedrooms, continues to show the shift in demand for smaller unit types as affordability remains a factor for today’s renters.
Based on the industry-standard qualification of 3x the monthly rent, renters require an individual qualifying income of $85,000 for studios/convertibles, and just over $111,000 for 1 bedrooms.
The downtown Chicago Class A market leased 4,592 units in Q2 2025 compared to 5,014 units in Q2 2024, a decrease of 428 units or -8.4%.
All seven submarkets experienced a decrease in total rentals in Q2 2025, indicating a limited supply, higher retention rates, and a scarcity of vacant lease-up units remaining.
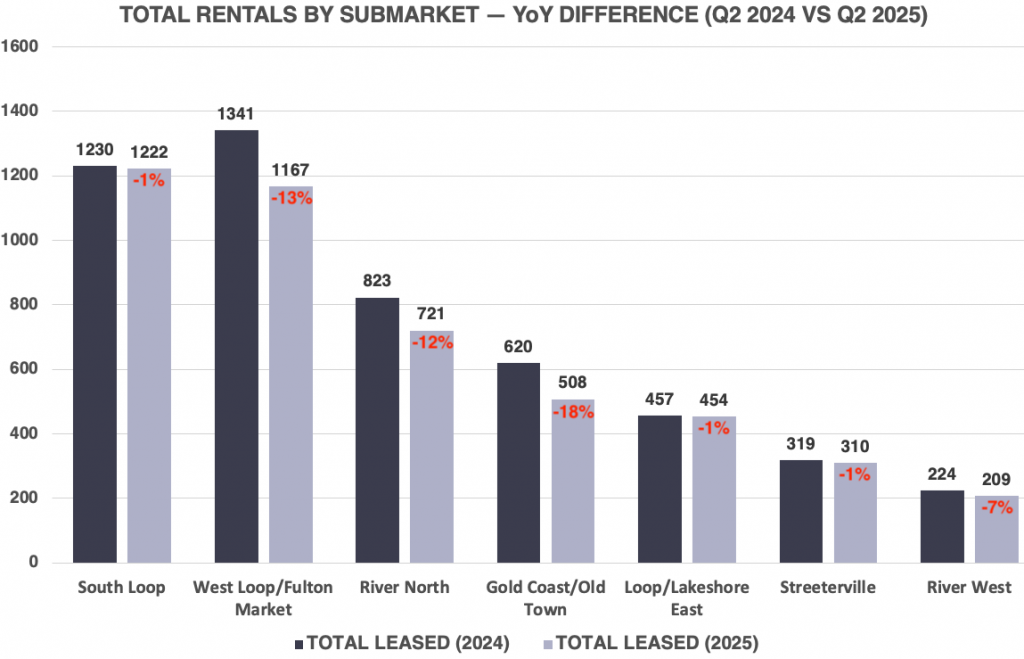
The West Loop/Fulton Market and South Loop continue to lead all submarkets in total rentals, largely due to more than half of the properties in this set having been delivered since 2016. Despite one active lease-up in the South Loop, total absorption was down slightly year-over-year.
West Loop/Fulton Market, which had the most lease-up activity in the city during Q2 2024, experienced a sharp 13% decline in total rentals in Q2 2025, with just one lease-up contributing to the total.
Gold Coast/Old Town experienced the steepest decline, down 18% year-over-year, followed by River North with a 12% drop. The shift from active lease-ups to a fully stabilized environment has created a noticeable reduction in total rental volume for both submarkets.
River West recorded only 25 fewer rentals compared to Q2 2024, but given the smaller size of the submarket, this represented a 7% decline. The remaining two submarkets also posted year-over-year declines, though more modest, ranging from 1% to 3%.
While the collective leased percentages across the city are at the highest levels in decades, Chicago is facing a significant shortfall in available inventory.
The graph below shows the total rentals by month, illustrating the steep drop in rentals with essentially zero lease-ups contributing to volume.
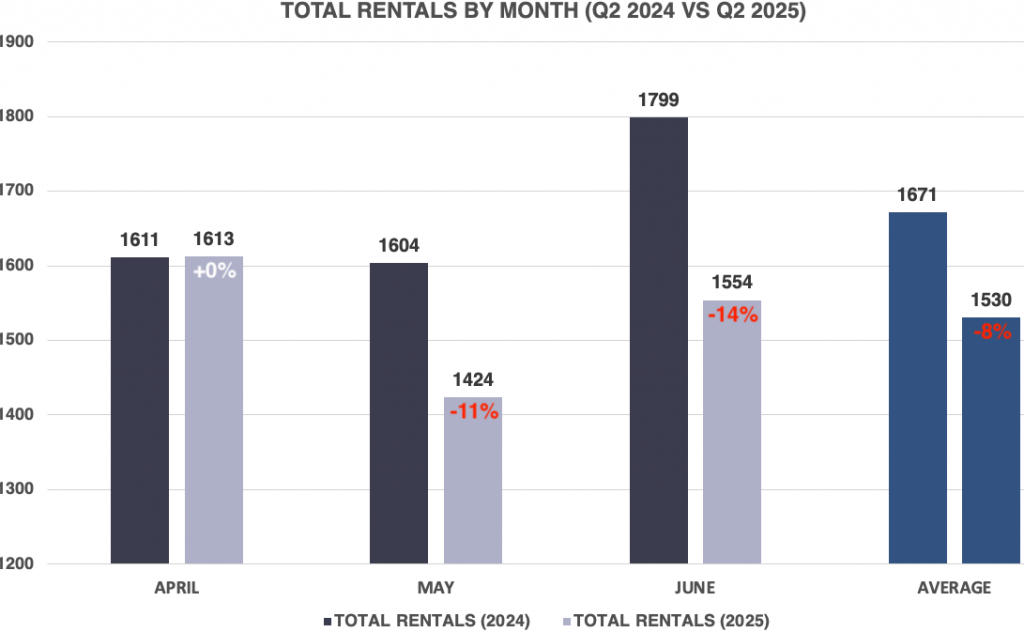
The overall decline in total rentals during Q2 2025 was concentrated primarily in May and June, as leasing volumes in April remained nearly flat year-over-year.
June saw the steepest drop, with total absorption down by 245 rentals (-14%), followed closely by May, which recorded a decline of 180 rentals (-11%).
Together, May and June accounted for a combined decrease of 425 rentals during what are typically the two strongest leasing months of the year.
Downtown Chicago could have easily absorbed over 1,000 more new units during the first half of 2025, and the market would have maintained a leased percentage over 95%.
Q2 2025 reinforced the strength of the Downtown Chicago Class A multifamily market, with both gross rents and PPSF continuing to climb due to limited supply. All submarkets saw steady rent growth despite a slowdown in absorption and fewer active lease-ups.
Larger unit types—particularly 2, 3, and 4 bedrooms—had a material impact on gross rent averages. Although these unit types account for a small share of total rentals, their size and price points carry significant weight. Meanwhile, 1 bedrooms remain the dominant unit type and drove much of the rent increase due to both volume and dollar growth.
Looking ahead, seasonality and rising exposure may soften rent growth in Q3. However, with record-high leased percentages and limited new supply, the Chicago’s Class A market is likely to stay elevated through year-end.
Leads and traffic will continue to fall as nearly all August expirations are accounted for, and September marks the beginning of the slower leasing season in Chicago. We’re in the final stretch.
At Luxury Living, we not only provide data, but analyze the data to help inform developers and capital partners to make the best decisions on pricing strategy, unit mix, and amenity programming.
Click Here to Download our Q2 2025 Chicago Class A Multifamily Market Update
Luxury Living is here to help you in all aspects of multifamily development. From pre-development consulting to marketing and leasing, we are Chicago’s multifamily leasing expert.