Luxury Living consistently tracks leasing data on larger assets in Downtown Chicago’s Class A Market built since 2016. This dataset currently includes 88 properties and over 29,000 total units—and counting. These properties set the tone for the broader downtown market.
FEBRUARY 2025 vs. FEBRUARY 2026
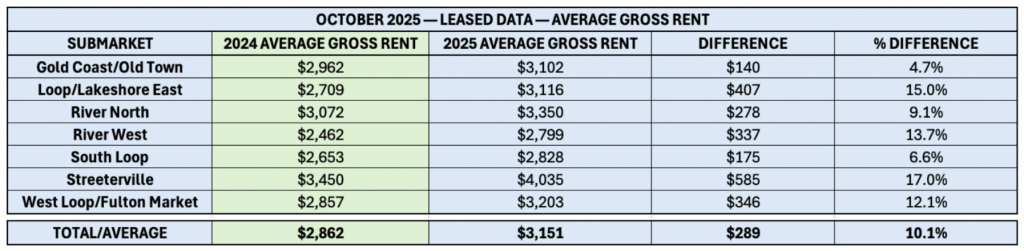
The most notable takeaway from Luxury Living’s 2025 Year in Review was the impact of limited new supply on pricing. In 2025, Downtown Chicago’s newer Class A properties experienced strong year-over-year rent growth, with average rents rising from $3,077 to $3,238 (+5.2%). This increase was driven by historically low new supply and higher retention of expiring leases. As availability tightened, leasing volume declined, with total rentals falling 8.2% for the year.
Heading into 2026, the key question is whether that pricing momentum will continue, particularly as the market approaches Q2, when rents accelerated sharply in 2025 due to elevated renewal rates and larger-than-average trade-outs.
Early 2026 data suggests these trends are continuing, with February 2026 rents increasing 5.1% higher than February 2025.
Leasing volume has declined year-over-year, while pricing has moved higher, even during a period in 2025 when the market had not yet fully responded to tightening supply conditions. Last year, pricing did not meaningfully accelerate until mid-March, making this early-2026 rent increase a critical baseline for comparison.
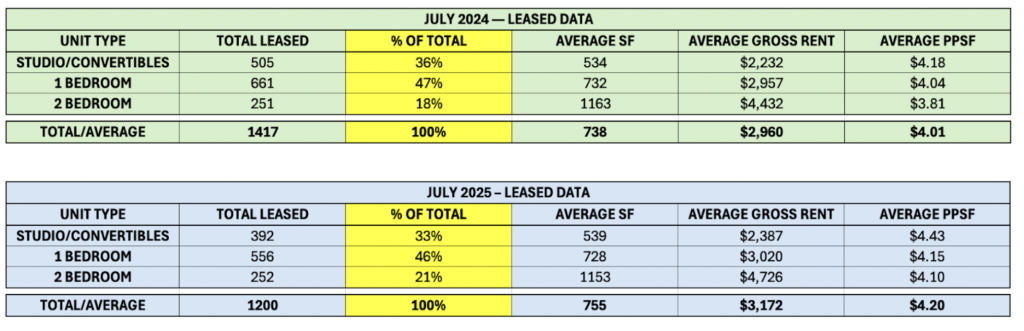
The tables below compare year-over-year performance for February 2025 and February 2026 across the most common unit types—studios through 2 bedrooms—which account for more than 97% of total leasing activity. February is historically one of the quietest months of the leasing year. The fact that average gross rent increased 5.1% year-over-year makes this metric even more important.
Rent Growth Is Real, But the Story Varies by Submarket
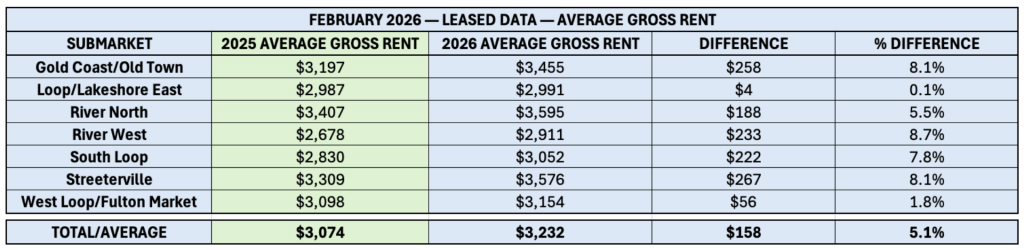
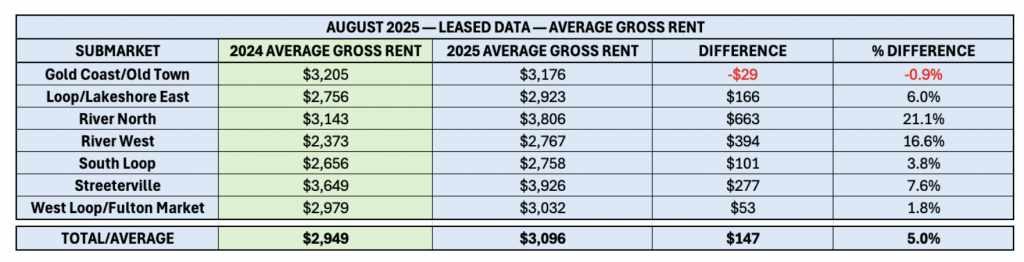
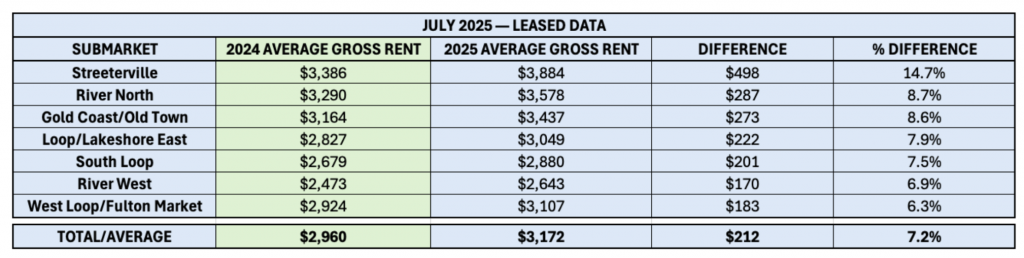
Nearly every submarket posted rent growth in February, but how they got there is where it gets interesting. Unit mix, property-level performance, and pricing strength on its own each played a role depending on the submarket.
- Gold Coast/Old Town (+8.1%) was supported by a shift toward larger units, with studios falling from 31% to 25% of leasing activity while 2 bedrooms climbed from 16% to 19%.
- Streeterville’s 8.1% gain is largely a property-level story, with two properties driving a disproportionate share of the increase, while much of the submarket held relatively flat.
- River West’s 8.7% increase is the most directly tied to unit mix, with average SF up 7.8% year-over-year. The PPSF tells a more measured story.
South Loop (+7.8%) and River North (+5.5%) both posted meaningful gains through different paths, with South Loop showing distributed growth across 17 properties, which is nearly 20% of the entire dataset. River North took a different path, driven by increased activity at select higher-end assets.
West Loop/Fulton Market (+1.8%) is arguably the most complex submarket story of the month. The headline masks extraordinary movement in both directions, with several properties posting gains above 30%, largely driven by a shift toward larger unit types, while others declined by double digits as unit mix moved in the opposite direction. There is significantly more to this submarket than the 1.8% average suggests.
Loop/Lakeshore East was the clear outlier at +0.1%, where a single new entrant to the dataset leased at below-market rents, pulling the submarket average down. Strip that out and the submarket posted over 2% growth.
Digging Deeper:
Headline rent growth tells part of the story, but the drivers behind it vary significantly by submarket. Where unit mix shifted, gross rents followed. Where it didn’t, pricing strength had to stand on its own. That distinction becomes clearer in the SF and PPSF data that follows.
Unit Mix: Mostly Stable, With Two Exceptions
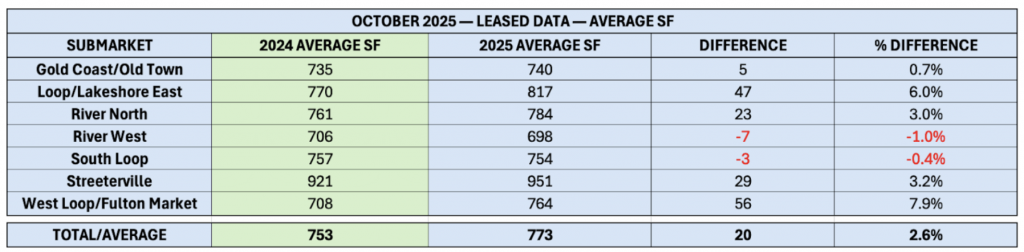
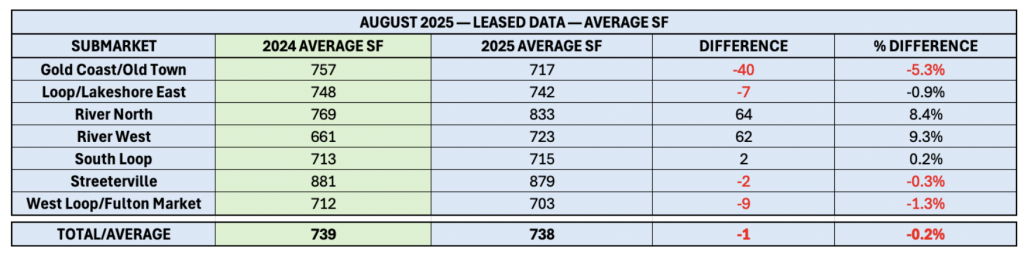
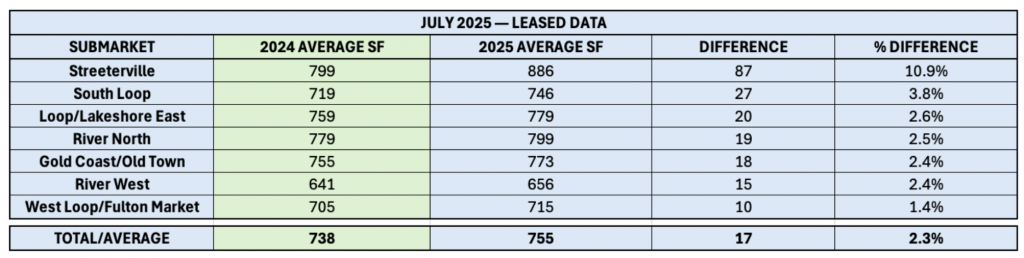
Year-over-year, average unit size increased slightly from 769 SF to 777 SF (+1.0%), which is essentially flat across the market. Where unit mix did shift, it shows up clearly in the data. Where it didn’t, something else is driving the rent growth.
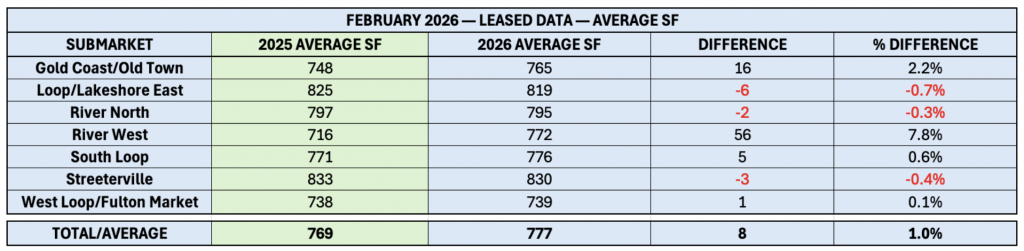
Unit size was mostly a non-factor this month. River West (+7.8%) stands out as the primary outlier, with a meaningful increase in average SF contributing to higher gross rents, while Gold Coast/Old Town (+2.2%) also experienced a more moderate increase in unit size.
In contrast, most submarkets remained flat or declined slightly year-over-year, including River North (-0.3%), Streeterville (-0.4%), and Loop/Lakeshore East (-0.7%). With unit size largely stable across the market, the majority of rent growth is attributable to pricing strength rather than shifts in unit mix.
This relationship becomes more apparent when evaluating PPSF in the following section, where pricing trends can be isolated from changes in unit size.
PPSF Confirms What Gross Rent Suggests
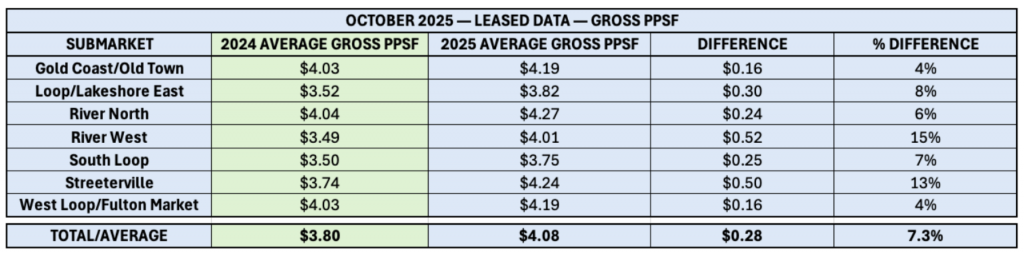
With average unit size remaining largely stable across the market, PPSF provides the clearest measure of true pricing movement. February data shows that PPSF increased from $4.00 to $4.16 (+4.1%) year-over-year, confirming that rent growth observed in prior sections is primarily driven by pricing rather than unit mix.
PPSF growth was consistent across most submarkets, with several areas posting notable increases. Streeterville (+8%) and South Loop (+7%) led the market, followed by Gold Coast/Old Town and River North (both +6%). In contrast, River West (+1%) and Loop/Lakeshore East (+1%) showed more modest gains, reflecting the influence of larger unit sizes on gross rents in those submarkets.
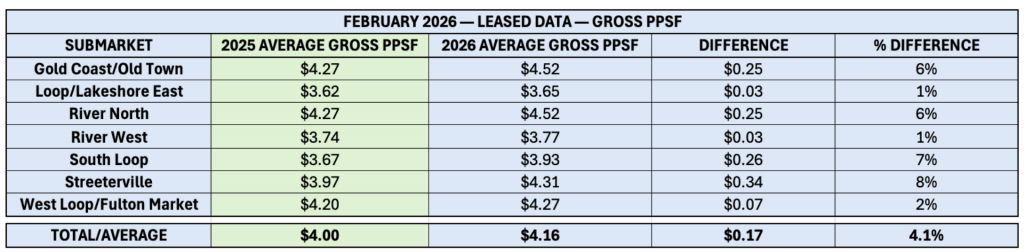
- Streeterville recorded the strongest PPSF growth (+8%), reinforcing its position as a pricing-driven submarket, though gains remain concentrated within a limited number of properties.
- South Loop (+7%), Gold Coast/Old Town (+6%), and River North (+6%) also posted strong gains, confirming that pricing momentum extends well beyond a single submarket.
- River West’s more modest PPSF growth (+1%) contrasts with its outsized rent increases, highlighting the impact of larger unit sizes on gross rent performance.
- Loop/Lakeshore East (+1%) reflects the influence of one property leasing at far-below-market rents, keeping the submarket average in check.
- West Loop/Fulton Market (+2%) saw some of the largest individual property swings in the entire market this month, with significant gains and losses nearly offsetting each other.
Digging Deeper:
While PPSF growth confirms pricing momentum across most of the market, the property-level data reveals just how concentrated, and in some cases how powerful, that momentum has become. In certain submarkets, a small number of assets account for a disproportionate share of the gains. In others, pricing strength is running so deep that it’s overcoming headwinds that would typically suppress rents.
The clearest example is in Streeterville, where one property saw gross rent decline by 7.9% due to a nearly 200 SF year-over-year drop in average unit size. On the surface, that looks like a down month. But PPSF tells a different story, jumping from $3.93 to $4.52, a 15% increase. Smaller units led to lower gross rent, and the 15% PPSF increase from this one property helped push the submarket to 8% growth.
Pricing Strength Across the Board
The submarket data shows where growth happened. The unit-type breakdown shows how consistent it was.
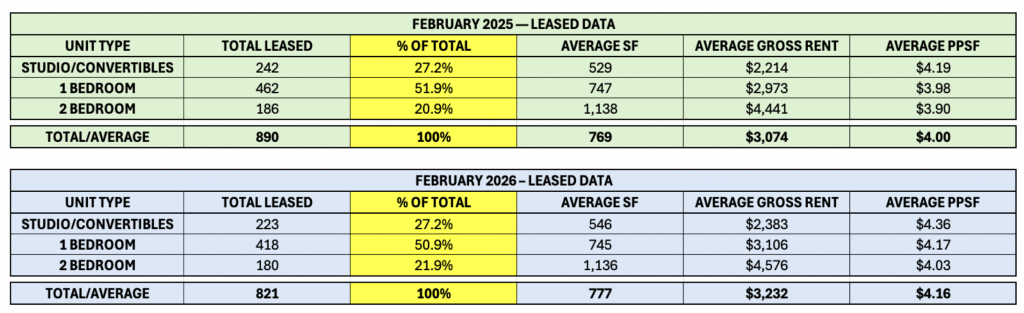
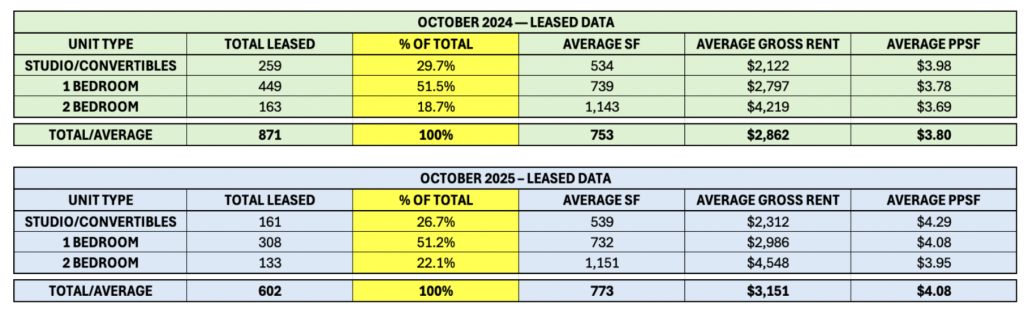
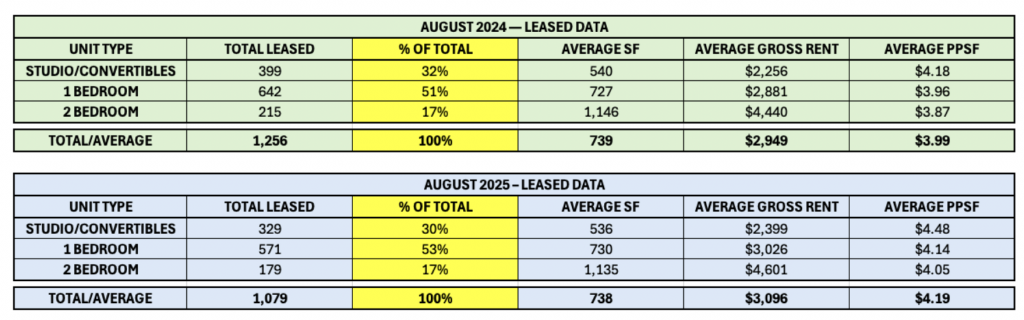
Unit type distribution remained stable year-over-year, with only minor shifts across studios, 1 bedrooms, and 2 bedrooms. Studios/convertibles accounted for 27.2% of leasing activity in both years, while 1 bedrooms declined slightly from 51.9% to 50.9% and 2 bedrooms increased modestly from 20.9% to 21.9%. This stability confirms that rent growth is a pricing story, not a unit mix story.
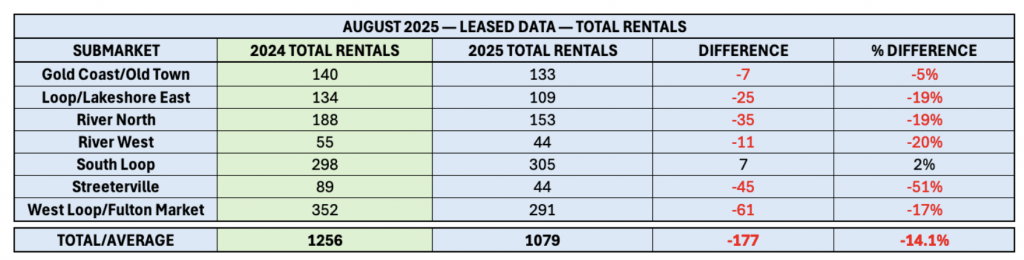
Total leasing volume declined 7.9% year-over-year, a notably smaller contraction than the double-digit monthly declines observed from May through October 2025. This suggests leasing activity may be stabilizing as the market approaches the spring leasing season, with reduced inventory continuing to drive lower absorption.
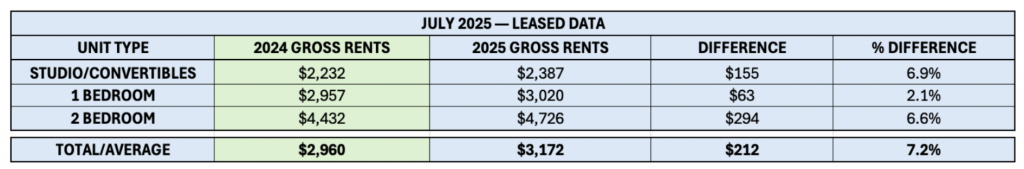
Unit-Type YoY Rent Increases:
- Studios/Convertibles: +7.6% in gross rent / +4.1% in PPSF / +3.2% in SF
- 1 Bedrooms: +4.5% in gross rent / +4.8% in PPSF / -0.3% in SF
- 2 Bedrooms: +3.0% in gross rent / +3.3% in PPSF / -0.2% in SF
Conclusion
February 2026 data delivers a clear signal heading into the spring leasing season: pricing power in Downtown Chicago’s newer Class A properties is not only intact, it’s holding at the market’s slowest moment of the year.
While total leasing volume declined 7.9% year-over-year, that contraction is notably shallower than the double-digit monthly drops recorded from May through October 2025, suggesting the floor may be forming ahead of the seasonal acceleration. Rent growth of 5.1%, essentially matching the full-year 2025 average, during a month when the market is at its quietest, is a more meaningful data point than the headline number alone implies.
The three-metric picture is consistent: gross rent up, average SF stable, PPSF up 4.1%. That combination leaves little room for a unit-mix explanation. The growth is real, and it’s showing up everywhere. Property-level concentration exists in select submarkets, but pricing momentum is running across unit types, price points, and nearly every corner of the market.
In 2025, rents didn’t begin to move meaningfully until mid-March. If February is already showing 5.1% growth before that acceleration kicks in, the setup for Q2 is compelling. Operators with stabilized assets are well-positioned and with minimal new supply coming online in 2026, pricing is likely to continue increasing