Chicago Class A Multifamily Market Update — Q3 2025

Luxury Living consistently tracks leasing data on larger assets in Downtown Chicago’s Class A Market delivered since 2016. This dataset currently includes 85 properties and over 28,500 total units—and counting. These properties set the tone for the entire market.
Tracking leased rentals, as opposed to available units (asking rents), shows what is really happening in the Chicago multifamily market.
The average gross rent in Q3 2025 was up 6.3% compared to Q3 2024.
This trend continues its year-long trajectory of rent growth, culminating in a 4.7% year-over-year increase through the first three quarters of the year.
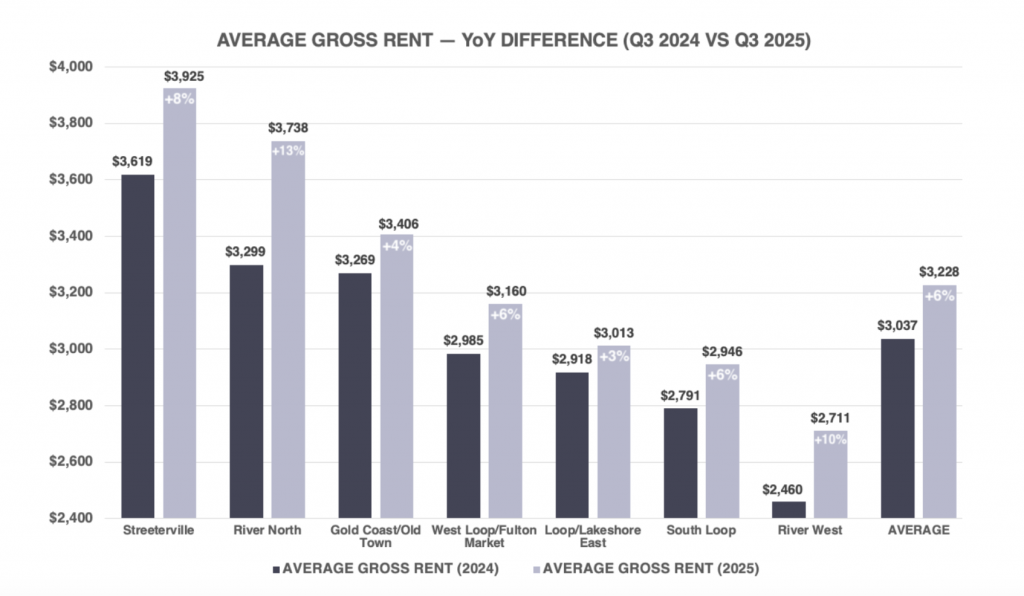
Average gross rent increased across all major downtown Chicago submarkets, with a 6.3% overall YoY gain, rising from $3,037 in Q3 2024 to $3,228 in Q3 2025.
River North posted the highest YoY rent growth at +13%, with average rents increasing from $3,299 to $3,738. While demand remains extremely strong in this submarket, the average square footage rose by 3.6%, indicating that a higher share of larger unit types contributed to the rent growth.
Similarly, gross rents in Streeterville rose 8%, from $3,619 up to $3,925, but also had an increase in average SF of 2.3%.
River West recorded the most notable gain, with gross rents up 10% YoY, while maintaining the same average unit size. This submarket rebounded from 2024’s very competitive concession-heavy environment in nearby Fulton Market, reestablishing its position as a strong value alternative within the downtown core.
The remaining four submarkets all rose from 3% to 6%.
Aside from River West, the four submarkets with the strongest rent growth also recorded the largest increases in average square footage. Even with that influence, overall market rents are trending upward across all submarkets.
The average PPSF in Q3 2025 was up 5.1% compared to Q3 2024.
All submarkets combined achieved an impressive $4.20 PSF, with four of the seven submarkets above $4.25 PSF.
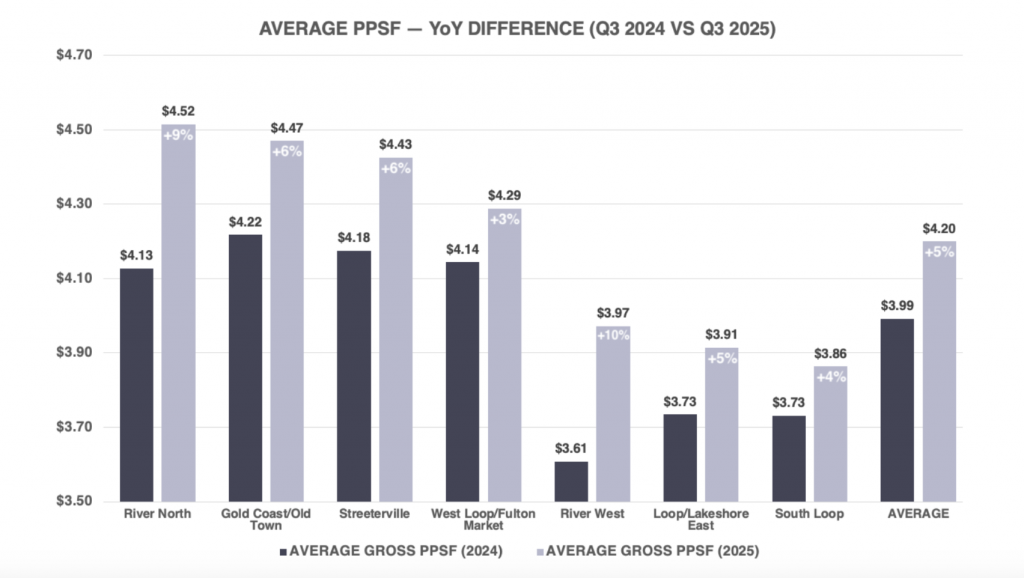
Gross rent increased 6.3% year-over-year, while average unit size rose 1.1%. Historically, an increase in average square footage tends to weaken PPSF gains. However, that was not the case in Q3 2025.
Gross PPSF climbed 5.1% during the same period, from $3.99 to $4.20, underscoring true rent growth and sustained demand across the market.
In Q3 2024, several lease-up properties nearing stabilization reduced asking rents and increased concessions in an effort to boost absorption. This forced stabilized properties to follow suit, temporarily driving down overall rent averages.
From August to September 2024, PPSF fell 3.0%, from $4.02 to $3.90. In contrast, during the same period in 2025, PPSF declined just 0.9%, from $4.21 to $4.17.
This demonstrates how the market has stabilized in a non-lease-up environment, with stronger rent retention and fewer concessions required to maintain demand.
Average square footage is a key data point that provides essential context for interpreting gross rents and gross PPSF. The graph below highlights the year-over-year differences in average square footage across each submarket.
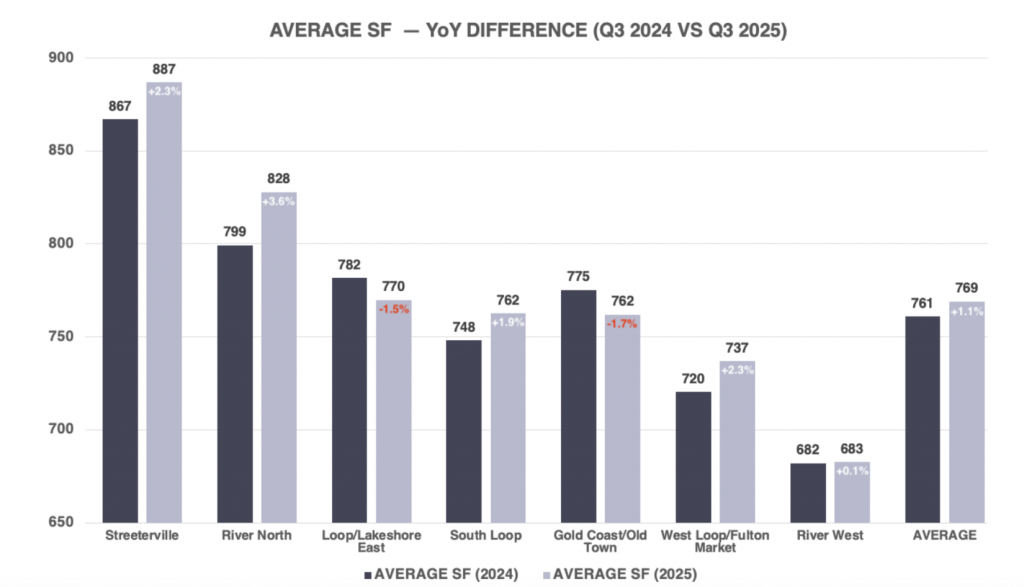
In Q3 2025, average gross rents rose by 6.3%, while average square footage increased by 1.1%, continuing the trend of heightened demand for larger unit types.
A trend that continues into Q3 2025, a slightly larger share of 3 and 4-bedroom units are contributing to the total rentals compared to 2024. This has been contributing to higher average SF and higher gross rents in some submarkets.
Unit mix distribution is the main factor for many of these large variances.
River North had the highest YoY increase in average gross rent and average SF. There was a 3% decrease in share of studio and convertible rentals in this submarket, which helps contribute to a much higher average on both fronts.
Streeterville also saw a significant rise in average SF and gross rent. When comparing the two quarters, there was a 5% increase in 2 and 3-bedroom rentals in Q3 2025 compared to Q3 2024. Additionally, there was a 3% drop in studio and convertible absorption, which continues to tilt the scale upwards.
Average SF in West Loop/Fulton Market rose 2.3% YoY, while it experienced a 3% increase in 2 and 3 bedroom rentals during the quarter.
Gold Coast/Old Town had the largest decrease in average SF (-1.7%), which can be directly connected to the 5% YoY increase in studio and convertible rentals, but still achieved a 4% increase in average gross rent for the quarter.
River West had a gross rent increase of 10% from Q3 2024, but maintained its average SF. Reiterating how a heavy concession atmosphere like Fulton Market in 2024 can draw in renters who would normally find the options to be unaffordable.
Throughout 2025, Luxury Living has been tracking YoY monthly data, and has intentionally segmented out the most common unit types: Studios through 2 bedrooms, which historically represent more than 97% of units leased. In Q3 2025, only 2.5% of all rentals within this set were 3 and 4-bedroom units.
The larger unit types can have a material impact on average gross rent, as they average well over $7,000 per month.
For all unit types, gross rents increased 6.3%, rising from $3,037 in Q3 2024 to $3,228 in Q3 2025.
The table below shows year-over-year data by unit type for Q3 2024 and Q3 2025, focused on studios through 2 bedrooms only.
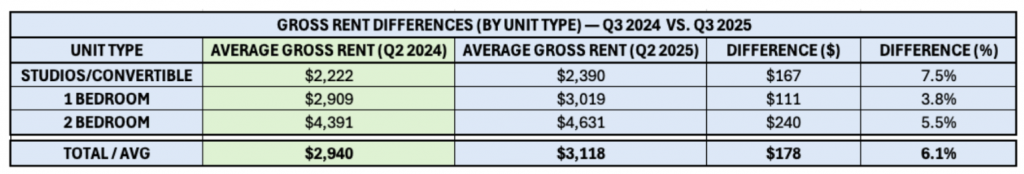
For 97.5% of all rentals in Q3 2025, the average gross rent increased from $2,940 to $3,118, a nearly identical 6.1% overall gain as compared to the full data set.
Average square footage remained stable — 740 SF in 2024 vs. 746 SF in 2025 (+0.7%) — helping to normalize rent trends. Despite the slight uptick in size, gross PPSF rose 5.3%, from $3.97 to $4.18, signaling genuine rent growth rather than size-driven inflation.
Studios and convertibles recorded the largest YoY increase, jumping 7.5% ($167 per month) on average. This gain also correlates with higher income qualification thresholds, as the average income required to lease these units increased by a similar margin.
1 bedroom units posted a 3.8% increase, surpassing the $3,000 threshold, while 2 bedrooms rose 5.5% (+$240 per month).
Overall, the rent performance in Q3 2025 effectively regained 2 to 3 years of prior rent suppression that occurred during the peak of concession-heavy lease-up cycles. A common trend seen since April 2025.
Within the dataset of the 85 properties being tracked, 3,033 units were leased in Q3 2025 compared to 3,628 units in Q2 2024, a decrease of 595 units or -16.4%.
This continues the trend from Q2 2025, where the past 6 months have seen a decline in absorption of 13.4% compared to 2024.
All seven submarkets experienced a decrease in total rentals in Q3 2025, indicating a limited supply, higher retention rates, and a scarcity of vacant lease-up units remaining.
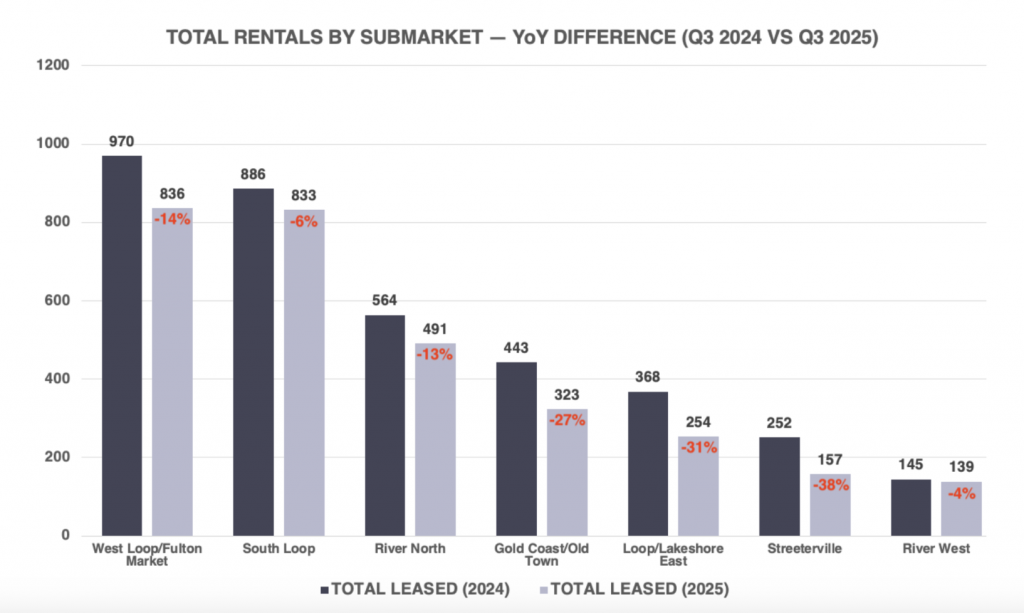
Leasing activity across downtown Chicago eased in Q3 2025, marking a natural shift from the high-volume lease-up years of 2023 and 2024. The drop in total rentals largely reflects tighter availability and steadier occupancy, not a decline in renter demand.
West Loop/Fulton Market recorded the highest leasing volume again in 2025, with 836 total rentals, though this represented a 14% decrease year-over-year. The South Loop followed closely with 833 rentals, down 6%, as absorption tapered after strong leasing through the first half of the year.
River North saw a 13% decline, totaling 491 rentals, consistent with reduced exposure and limited availability at stabilized properties. The largest year-over-year decreases occurred in Streeterville (-38%), Loop/Lakeshore East (-31%), and Gold Coast/Old Town (-27%), all areas with minimal new supply and sustained high occupancy levels.
Despite the lower volume, these declines reflect a healthy market rather than demand weakness. With fewer lease-up projects competing for renters and limited new deliveries, leasing activity has shifted from high turnover toward retention and stabilized performance, a positive indicator for overall rent stability entering 2026.
The graph below shows the total rentals by month, illustrating the steep drop in rentals with near zero lease-ups contributing to volume.
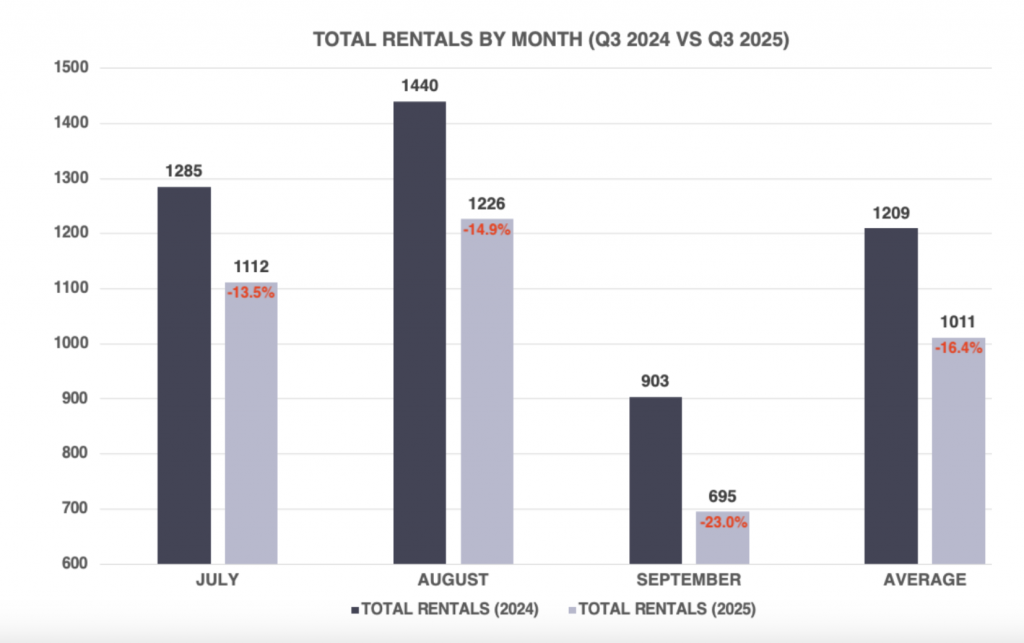
Leasing velocity in Q3 2025 trended lower across all three months compared to the same period in 2024, as the market transitioned further from a lease-up environment to fully stabilized. Overall, total rentals averaged 1,011 per month, down 16.4% year-over-year.
July posted 1,112 rentals, a 13.5% decrease from 2024, marking a weaker month during peak leasing season.
August, which had a very strong 2024, dropped nearly 15% in 2025. September showed the largest drop, down 23% year-over-year to 695 rentals, reflecting the sharp slowdown typical after Labor Day combined with fewer available units.
While the pace of leasing has moderated, these declines align with broader market normalization. Most downtown assets are now stabilized, and historically low deliveries in 2025 have resulted in less turnover and lower exposure. The reduction in total rentals, therefore, reflects a healthy tightening of supply rather than weakening demand, setting the stage for continued rent growth and stability into 2026.
Rents in Q1 2025 showed minimal growth compared to the strong gains that began in April 2025, and many operators are expected to capitalize on that momentum with aggressive renewal increases in Q1 2026. As a result, retention could begin to soften, particularly as affordability and income qualification thresholds continue to tighten. This dynamic could lead to a modest rise in inventory and greater competition early in the 2026 leasing season.
Chicago’s multifamily market continues to show steady strength and resilience through 2025. While leasing activity has slowed compared to the lease-up peaks of recent years, the market has clearly entered a more stable phase. This is defined by healthy occupancy, strong renewal performance, and consistent rent growth across nearly every downtown submarket.
Looking ahead to 2026, many operators will likely push renewal rates higher to capture recent momentum. That could test renter retention as affordability and income qualifications become bigger factors, but overall demand remains strong.
With limited new supply on the horizon and continued interest in well-located, high-quality properties, Chicago’s downtown multifamily market is well-positioned for another year of above average rent growth.
At Luxury Living, we not only provide data, but analyze the data to help inform developers and capital partners to make the best decisions on pricing strategy, unit mix, and amenity programming.
Click Here to Download our Q3 2025 Chicago Class A Multifamily Market Update
Luxury Living is here to help you in all aspects of multifamily development. From pre-development consulting to marketing and leasing, we are Chicago’s multifamily leasing expert.