Chicago Class A Multifamily Market Update — YoY August 2025 Rental Data

Luxury Living consistently tracks leasing data on larger assets in Downtown Chicago’s Class A Market built since 2016. This dataset currently includes 85 properties and 28,500 total units—and counting. These properties set the tone for the entire market.
Supply constraints in Chicago’s multifamily market continue to shape availability and pricing. Since January 1, 2025, available inventory has dropped 38.4%, declining from 2,649 units in the first week of the year to 1,641 as of September 10, 2025.
Collectively, this set of properties is 97.5% leased, though several properties remain below the 95% benchmark. Strong performance from the upper tier is sustaining the overall average.
Our July 2025 Multifamily Market Update highlighted an unprecedented average gross rent increase of 7.2%. In August, growth moderated to 5.0% year-over-year (+$147), reflecting a more sustainable pace.
Similar to unit-mix rental patterns we have been tracking in the South Loop, a high quantity of upper-end 2 bedroom rentals have spiked rents in River North, dramatically impacting the market averages.
To further exemplify this point, when River North is excluded from the set, gross rents only increased 2.2% YoY.
Now let’s dig in to see how this happened.
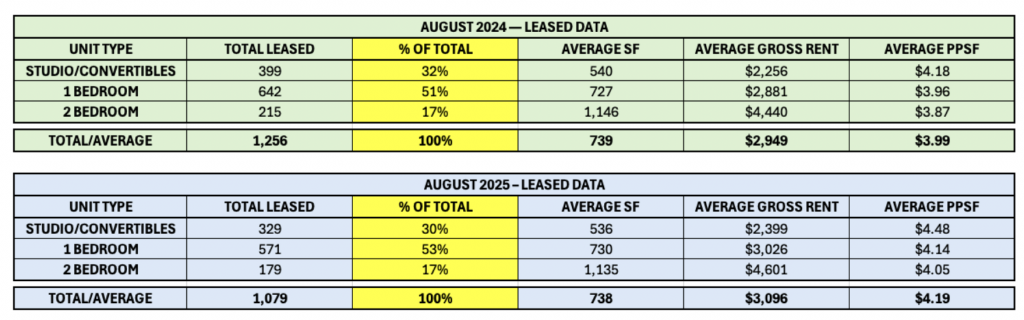
The tables below show YoY data for August 2024 and August 2025 for the most common unit types: Studios through 2 bedrooms, which historically represent more than 97% of units leased.
With YoY square footage essentially flat (within 1 SF) the data provides an accurate basis for comparison. However, when broken down by submarket, there are three major outliers: Gold Coast/Old Town, River North and River West.
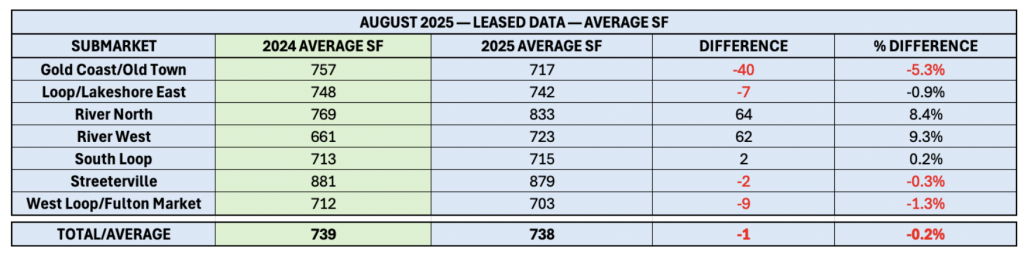
Tracking unit mix is crucial for evaluating rent fluctuations in the market, as SF directly impacts gross rents.
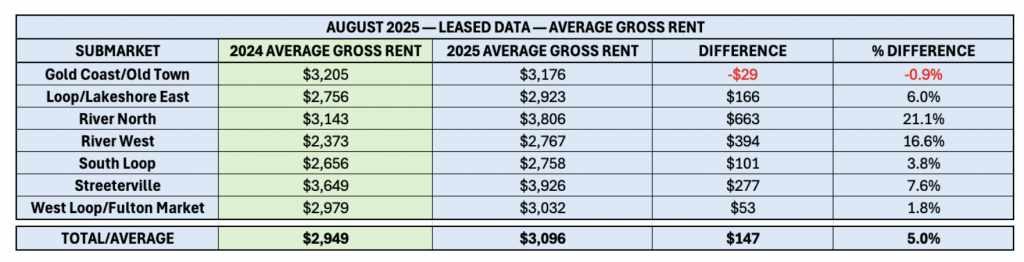
Expanding on River North, 2-bedroom absorption was at parity YoY, but average gross rents increased $680 (+14.1%), led by a higher quantity of premium upper-floor inventory.
Q — How much did the gross rents in River North impact the overall numbers?
A — When River North is excluded from the August data, gross rents only rose 2.2% ($2,915 up to $2,979).
The 2 bedrooms in River North provided a “disproportionate contributor” to perceived rent growth.
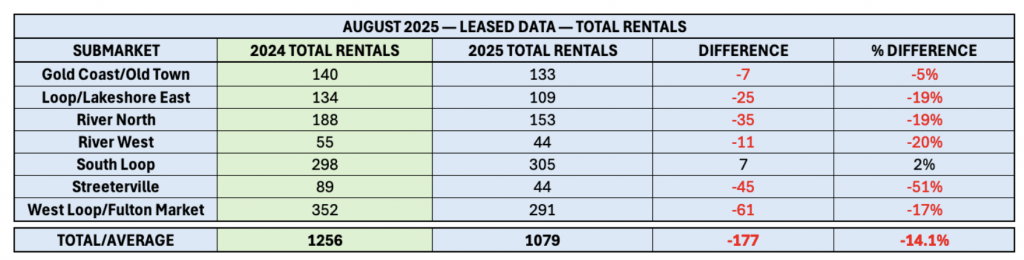
South Loop and West Loop/Futon Market accounted for 52% of the total rentals in August, and the two submarkets had modest gross rent increases of +3.8% and +1.8%, respectively. These are the two most competitive submarkets in Chicago due to the significant amount of new properties added over the last 10 years. The amount of inventory also creates a barrier to increasing rents, due to higher levels of competition, unlike in River North and the Gold Coast/Old Town.
The extreme dip in absorption in Streeterville (-51%) can be attributed to a lease-up in 2024 that was fully stabilized in 2025.
Gold Coast/Old Town (-7) and South Loop (+7) were the only two submarkets within 5% variance from 2024.
Reviewing leased data down to the unit type will provide additional insight into YoY variances.
August had another sizable drop of 14.1% in absorption in 2025 compared to 2024, continuing the trend of YoY decreases in total monthly rentals starting in May. This marks the fourth consecutive month with double-digit percentage declines in monthly absorption, and this trend is likely to continue through the end of the year due to the ultra-limited supply in Chicago.
Unit-type variations:
As a percentage of total rentals, 1 bedroom units increased slightly to 53% of total rentals, while studios/convertibles declined 2%. Meanwhile, 2 bedrooms held steady at 17% of the market.
As we continue to monitor current availability, only 21% of the current inventory is designated as studios or convertibles, far below the monthly demand for this unit type.
Chicago’s Class A multifamily market remains resilient amid extremely tight supply. Available units are down 38.4% year-to-date, with the full set of 85 properties at 97.5% leased heading into the slowest leasing months of the year. While many properties sit below the 95% benchmark, strong performers continue to lift overall averages.
Rent growth eased from July’s 7.2% surge to 5.0% in August, though River North’s premium 2 bedrooms drove a 21.1% gain. Excluding this submarket, rents rose just 2.2%, underscoring the outsized impact of a single contributor.
Submarket results were mixed: Streeterville posted solid gains, West Loop/Fulton Market saw only modest growth, and Gold Coast/Old Town declined due to smaller unit sizes. South Loop and West Loop/Fulton Market together represented over half of total rentals, reinforcing their dominance in the market.
As we continue into the slower leasing months, we are most interested in seeing how the limited supply contributes to YoY rent growth. This is generally a time when lease-ups push to stabilization, offering heavy concessions to increase velocity.
This will be the first Q4 where that variable will not factor into the leasing landscape, potentially leading to historic rent growth.
Luxury Living is here to help you in all aspects of multifamily development. From pre-development consulting to marketing and leasing, we are Chicago’s multifamily leasing expert.