Chicago Class A Multifamily Market Update — YoY October 2025 Rental Data

Luxury Living consistently tracks leasing data on larger assets in Downtown Chicago’s Class A Market built since 2016. This dataset currently includes 85 properties and 28,500 total units—and counting. These properties set the tone for the entire market.
There have been several major supply-related storylines in the Chicago multifamily market throughout 2025.
The most consistent theme has been supply and demand. Demand has not waned, but supply is at an all-time low.
Let’s first take a look at how the lack of supply is impacting rents.
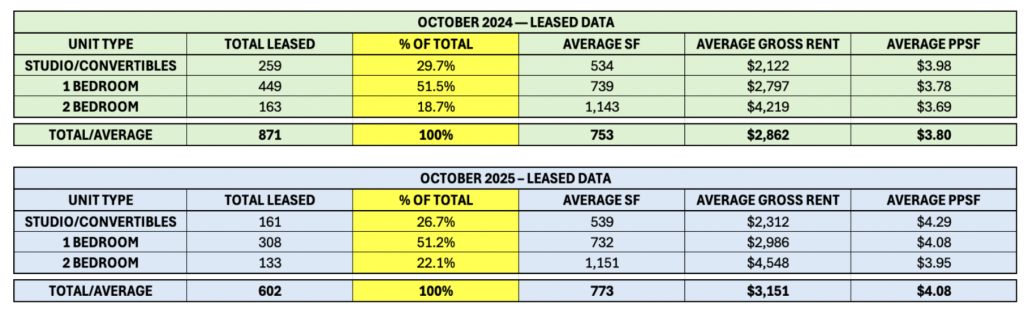
The tables below show YoY data for October 2024 and October 2025 for the most common unit types: Studios through 2 bedrooms, which historically represent more than 97% of units leased.
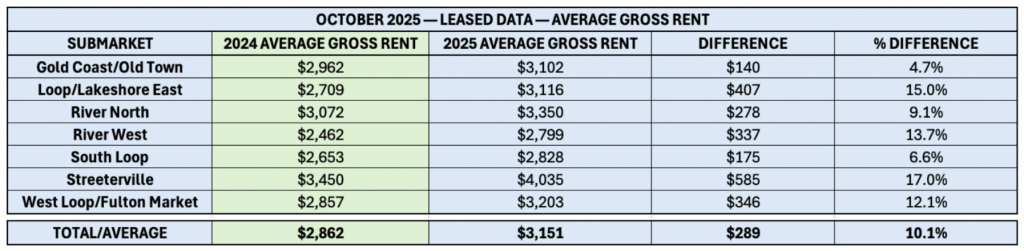
Average rent is up 10.1% ($289 per unit). This is the highest rent increase we have seen in a single month.
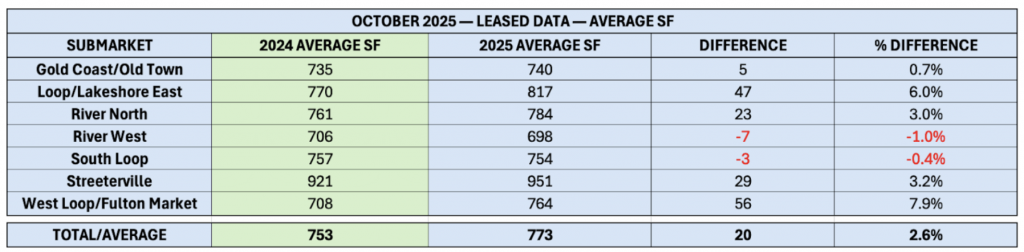
YoY square footage up 2.6%, rising from 753 SF to 773 SF, showing a slightly higher share of unit types larger than 1 bedrooms leasing in submarkets like West Loop/Fulton Market, Loop/Lakeshore East, Streeterville, and River North.
A 2.6% increase in average unit size has a noticeable impact on average gross rents. Smaller unit type absorption declined significantly year-over-year: studios and convertibles were down 38%, and 1 beds were down 31%, while 2 bedrooms declined only 18%. With fewer small units and a relatively stable share of 2 bedrooms, the overall unit mix shifts toward larger-unit absorption (2 Bedroom+). This shift naturally elevates average gross rents, even before factoring in rent growth.
Tracking unit mix is crucial for evaluating rent fluctuations in the market, as SF directly impacts gross rents.
October 2024 represented a unique moment in the market, when several lease-ups were pushing hard to reach stabilization. Instead of offering concessions, many properties chose to reduce rents outright, which sharply depressed achieved pricing heading into Q4.
To show how dramatic this dynamic was:
In 2024, average PPSF fell to $3.80 in October 2024, compared to $4.02 in August and $3.90 in September. Achieved PPSF in October 2024 was down 5.5% from August 2024 and down 2.6% from September 2024—not quite falling off a cliff, but certainly a steep and unusual drop.
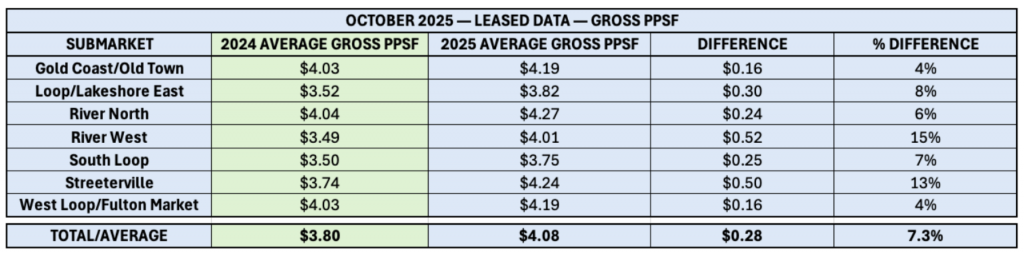
This year’s 7.3% increase in PPSF is partially driven by limited supply, but it also reflects a “double bounce” effect as the market corrects back upward from last year’s artificially depressed pricing.
Operators across the city are seeing exceptionally strong renewal rates and trade-outs as a result, and this dynamic is expected to continue into early 2026.
Reviewing leased data down to the unit type will provide additional insight into YoY variances.
Monthly absorption has been rapidly declining since May, but October recorded the steepest year-over-year reduction at 31%, marking the sharpest contraction of the 2025 leasing season. While nearly one-third of the total rental volume from 2024 has vanished, the mix of units being absorbed also shifted.
As a share of total rentals, studios/convertibles declined 3.0%, while 2 bedrooms increased 3.4%, and 1 bedroom absorption remained essentially flat. Studios and convertibles saw the most significant drop, with 98 fewer rentals, representing a 38% YoY decline compared to October 2024.
Despite the sharp differences in absorption, PPSF increases were relatively consistent, ranging from 7.0% to 7.8%. Gross rent increases showed more variation, from 6.8% to 9.0%, primarily driven by shifts in unit mix and the larger average square footage in the 2025 data set.
The combination of unit-type absorption patterns and a 2.6% increase in average square footage contributed to gross rent and PPSF growth that exceeded typical seasonal expectations. The underlying dynamic is clear: with fewer smaller units available, and a higher proportion of larger floor plans absorbing, both gross rent and PPSF naturally pushed higher.
October’s results reinforce what we’ve seen all year: demand is strong, but the market simply doesn’t have enough new supply to absorb it. With available Class A inventory down 36.5% since January, every metric in this report points back to the same underlying issue: renters are competing for fewer options.
Rents rose sharply across nearly every submarket, with average gross rent up 10.1% and PPSF up 7.3%. A shift toward leasing larger units also played a meaningful role, as average square footage increased 2.6% year-over-year.
Unit-type absorption helps explain the jump. Studio and convertible absorption dropped 38%, while 2 bedroom absorption held more steady, pushing the overall mix toward larger homes that command higher rents. PPSF growth was consistent across all unit types, landing between 7.0% and 7.8%.
This is also a “double bounce” year. October 2024 pricing was unusually depressed due to multiple lease-ups dropping rents to reach stabilization, creating an artificially low baseline. The 2025 recovery reflects both genuine rent growth and a correction back to normal pricing levels.
Looking forward, this dynamic should continue through early 2026. With so little new supply delivering, renewal strength and trade-outs will remain elevated.
Luxury Living is here to help you in all aspects of multifamily development. From pre-development consulting to marketing and leasing, we are Chicago’s multifamily leasing expert.