Chicago Class A Multifamily Market Update — Q1 2026

Luxury Living consistently tracks leasing data on larger assets in Downtown Chicago’s Class A Market built since 2016. This dataset currently includes 88 properties and over 29,000 total units—and counting. These properties set the tone for the broader downtown market.
Tracking leased rentals, as opposed to available units (asking rents), shows what is really happening in the Chicago multifamily market.
To read Q1 2026 data accurately, it helps to understand that Q1 2025 was the quietest quarter of the year. Rents didn’t begin to accelerate until mid-March and didn’t hit their stride until April and May, when aggressive renewal activity and tightening supply pushed pricing well above Q1 levels. By year-end, average gross rents had risen from $3,077 to $3,238, a 5.2% increase for the full year, with most of that growth coming after Q1.
That makes Q1 2026 a more interesting comparison than it might first appear. The market is now being compared against the lowest rents of 2025, while operators are pushing renewal increases more aggressively than they did a year ago. The question heading into this quarter was whether renewal increases would support rents on new leases, or whether tenants choosing not to renew would start to add inventory back to the market and create competition.
Q1 2026 data shows pricing has continued on the same path as 2025. Average gross rents rose 5.3% year-over-year, from $3,176 to $3,345, while total leasing volume declined 11%. Fewer leases, higher rents. That pattern has now held for several consecutive quarters. This increase is driven by both rent growth and a shift toward more 2 bedroom rentals, lifting average rents.
Studios and convertibles fell from 28% to 26% of all leasing activity in Q1 2026, while 2 bedrooms climbed from 19% to 22%. Total leasing volume declined 11% year-over-year, from 3,325 to 2,959 units. The decline is most clearly seen in shifts in unit mix.
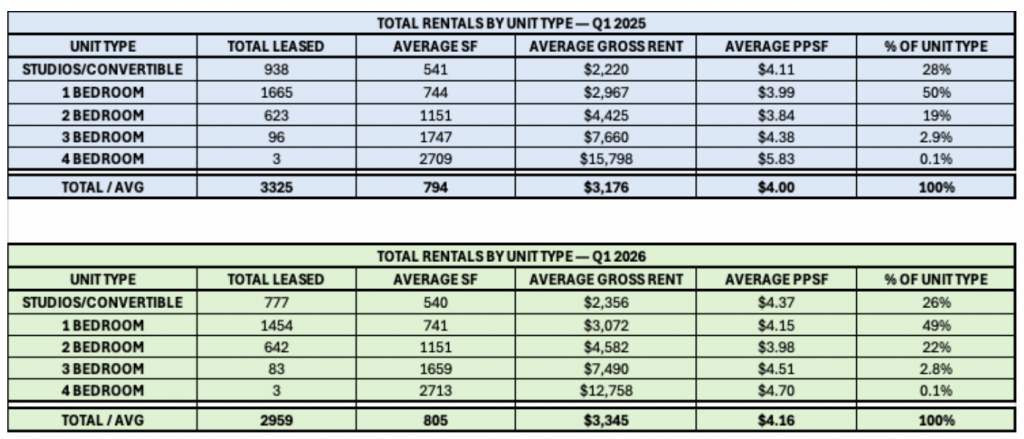
Studios and convertibles posted the strongest rent growth of any unit type, up 6.1% year-over-year to $2,356. Average square footage held essentially flat at 540 SF, confirming pricing is driving the increase, not larger units pulling up the average. At the same time, studios fell as a share of total leasing.
A 1 bedroom in Q1 2026 averaged $3,072 per month, requiring an annual income of roughly $111,000 to qualify. For renters below that threshold, a studio or convertible is the most practical option. And many are staying in place because moving to a comparable unit would cost them more. Likely higher retention is limiting turnover among studios, with the units that do come to market achieving higher rents.
Studios and 1 bedrooms combined accounted for 78% of all leasing in Q1 2025 and 75% in Q1 2026. The income qualification gap between those two unit types is dictating many of the leasing decisions in downtown Chicago’s newer Class A buildings.
2 bedrooms climbed from 19% to 22% of all leasing activity, with rents up 3.6% year-over-year. Average square footage held flat at 1,151 SF in both years. Despite overall leasing volume declining 11%, 2 bedroom volume actually increased from 623 to 642 units, making it the only unit type to gain share and increase leasing volume in a market where total activity declined 11%.
On the other end, 1 bedrooms slipped slightly from 50% to 49% of all leasing, with rents up 3.5%. Volume declined from 1,665 to 1,454 units, the steepest drop of any unit type, which likely reflects the studio retention trend.
The submarket data shows how these trends varied across downtown Chicago.
Average gross rents increased across all seven downtown submarkets in Q1 2026, rising from $3,176 to $3,345 year-over-year. But the range of gains, from 1.7% to 13%, makes the market-wide average less effective on its own.
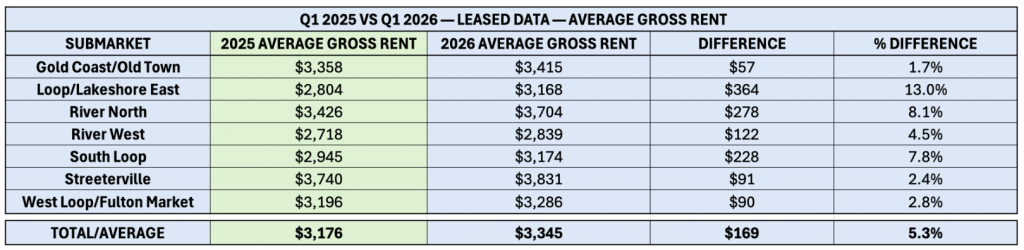
River North posted an 8.1% gross rent increase, rising from $3,426 to $3,704, with unit mix shifts driving much of that increase. The share of studio rentals in River North fell from 25.6% to 19.7%, while 2 bedrooms climbed from 19.8% to 24.5%. This resulted in a 3% jump in average SF, from 805 to 828. Performance varied by unit type, with studios up 8%, 1 bedrooms up 3.6%, and 2 bedrooms up 3.8%.
No submarket saw a bigger shift toward 2 bedrooms than South Loop, where that unit type climbed from 19.6% to 24.8% of all leasing activity, driving average SF from 797 to 822 and pushing gross rents up 7.8%, from $2,945 to $3,174.
Loop/Lakeshore East posted the largest gross rent increase of any submarket at 13%, from $2,804 to $3,168, but this increase is almost entirely driven by unit mix. Studio leasing dropped from 33.7% to 26.4% of all activity, while 2 bedrooms rose from 15.2% to 22.7%. Average SF jumped from 787 to 849 (+7.8%), the largest increase of any submarket.
Two buildings in the submarket saw rents climb over 20% year-over-year, one with average SF jumping from 879 to 1,057 and another from 702 to 797. By unit type, studios were up 5%, 1 bedrooms up 6%, and 2 bedrooms up 6.4%. These are solid gains, but they do not fully support a 13% increase at the submarket level.
West Loop/Fulton Market presents a different pattern. Unit mix remained largely unchanged year-over-year, with studios, 1 bedrooms, and 2 bedrooms each holding within one percentage point of their 2025 shares. Average SF dipped slightly from 770 to 760. The 2.8% gross rent increase, from $3,196 to $3,286, reflects straightforward pricing growth.
Average square footage is a key data point that provides essential context for interpreting gross rents and gross PPSF. The table below highlights the year-over-year differences in average square footage across each submarket.
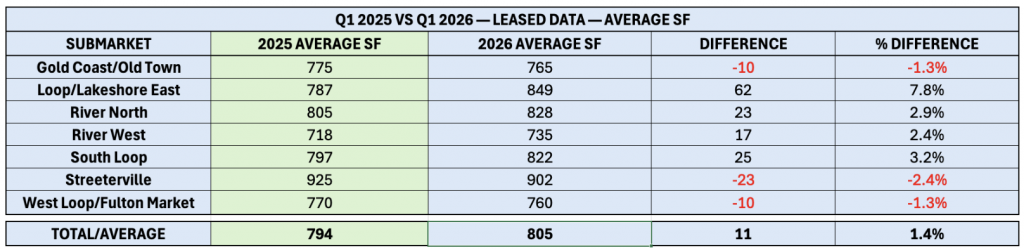
Average gross rents rose 5.3% in Q1 2026, while average square footage increased 1.4%. For much of the market, that increase explains a portion of rent growth, as larger units leased at higher prices. But in three submarkets where average SF actually declined, rents still rose, and that is where pricing growth is most clearly occurring.
The three submarkets where average SF declined deserve the most attention. Streeterville (-2.4%), Gold Coast/Old Town (-1.3%), and West Loop/Fulton Market (-1.3%) all posted rent increases despite smaller average unit sizes year-over-year. Unit mix is not the primary factor behind those increases, and that context matters for understanding where the rent growth is coming from.
West Loop/Fulton Market is worth examining more closely. One property saw average SF jump over 200 SF with rents up nearly 37%, while another dropped nearly 170 SF with rents declining 8%. Those two properties nearly offset each other, leaving the submarket with a modest -1.3% SF decline and 2.8% rent growth.
In submarkets where average SF declined and rents still rose, PPSF provides a clearer measure of pricing.
The average gross PPSF in Q1 2026 was $4.16, up 3.9% from Q1 2025, with gains across all seven submarkets.
Gross rent can be influenced by shifts in what is being leased, while PPSF removes that variable and provides a clearer view of true pricing. PPSF growth was more consistent across submarkets, showing that pricing strength extends beyond unit mix.
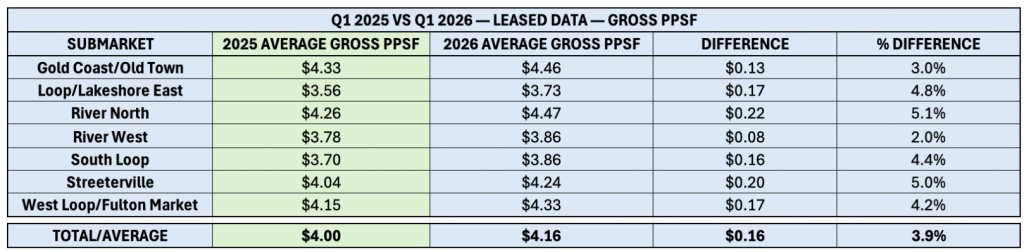
River North led all submarkets with a 5.1% increase, followed by Streeterville at 5.0%, and Loop/Lakeshore East at 4.8%. Streeterville’s result deserves a closer look. Gross rent rose only 2.4%, as smaller average units suppressed that figure. Pricing was stronger than the gross rent figure suggested. Loop/Lakeshore East is the inverse. Gross rent climbed 13.0%, but PPSF growth of 4.8% shows that the bulk of that increase came from larger units being leased, not pricing alone.
South Loop and West Loop/Fulton Market posted increases of 4.4% and 4.2%, respectively. In West Loop/Fulton Market, where unit mix remained stable and average SF declined, PPSF growth points to pricing increases that are not influenced by unit mix or size shifts.
Gold Coast/Old Town and River West saw increases of 3.0% and 2.0%. Gold Coast/Old Town’s gross rent rose only 1.7%, but with average unit sizes declining year-over-year, PPSF shows stronger pricing than the gross rent figure suggested.
River West presents the opposite pattern, with gross rent up 4.5%, but average SF rising 2.4%, indicating that a portion of that increase was driven by larger unit sizes rather than pricing.
Collectively, every submarket posted positive PPSF growth, with most showing increases ranging from 3% to 5%. The market continues to move in one direction, with pricing gains across all submarkets.
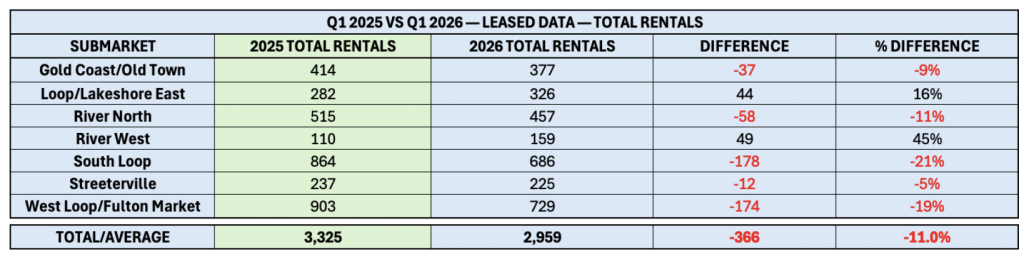
Total leasing volume across all seven submarkets fell 11% in Q1 2026 compared to Q1 2025, with 2,959 leases compared to 3,325 the prior year.
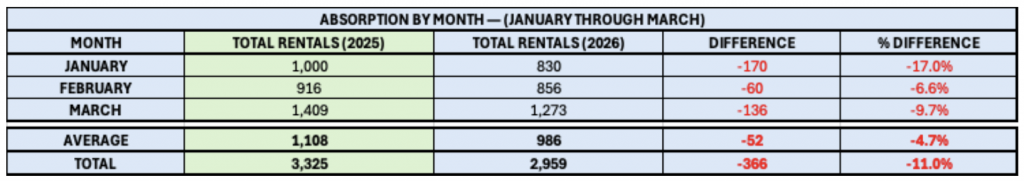
Leasing activity in Q1 2025 was supported by several lease-ups working toward stabilization, which increased available inventory. With far fewer lease-ups active in Q1 2026, the market is operating in a more stabilized environment, and the decline in volume is more a function of limited supply than reduced demand. This continues a trend that ran throughout 2025, as lease-up volume faded and overall activity pulled back.
The monthly pattern is also worth a look. January saw the sharpest decline at -17%, while February narrowed to -6.6%, the smallest gap of the quarter. March remained the highest-volume month in both years, with 1,273 leases recorded in Q1 2026 compared to 1,409 in Q1 2025, a -9.7% difference. The market’s seasonal pattern held intact even as overall volume declined.
The decline in volume points to constrained supply and sustained pricing strength, not weaker demand.
South Loop and West Loop/Fulton Market together accounted for 352 of the market’s 366-unit decline, meaning the overall -11% decline was driven primarily by just two submarkets.
Both submarkets had the most lease-up activity in Q1 2025, creating a high baseline that Q1 2026 was not positioned to match. As those properties moved toward stabilization, the pool of available units in both submarkets shrank, dragging volume down with it.
Across the remaining five submarkets, only Loop/Lakeshore East and River West posted volume gains, up 16% and 45% year-over-year.
The increase in Loop/Lakeshore East leasing activity was driven almost entirely by 2-bedroom demand. Leases in that unit type rose from 43 to 74, a 72% increase. This points to renters seeking value. At $4,161 per month, Loop/Lakeshore East 2 bedrooms are priced 9.2% below the market average, with average unit sizes nearly identical at approximately 1,150 SF. On a PPSF basis, Loop/Lakeshore East 2 bedrooms at $3.62 remain well below Streeterville at $4.17 and River North at $4.38, confirming a pricing advantage relative to comparable submarkets.
River West’s increase in leasing activity was driven by 1-bedroom demand, with leases in that unit type rising from 47 to 76, a 62% increase year-over-year. At $2,714 per month, River West 1 bedrooms are priced 11.7% below the market average of $3,072, positioning the submarket as the most affordable entry point into the downtown Class A market. For renters prioritizing price, comparable 1 bedrooms in West Loop/Fulton Market average $3,079, River North $3,297, and Gold Coast/Old Town $3,306. The pricing gap is clear, and the leasing data shows renters responded.
Taken together, the data shows that while overall volume declined due to reduced lease-up supply, renters remained highly responsive to pricing, driving volume gains in submarkets offering clear value.
Throughout 2025 and 2026, Luxury Living has been tracking YoY monthly data, and has intentionally segmented out the most common unit types: Studios through 2 bedrooms, which historically represent more than 97% of units leased. In Q1 2026, only 2.9% of all rentals within this set were 3 and 4-bedroom units.
The larger unit types can have a significant impact on average gross rent, as they average well over $7,000 per month.
For all unit types, gross rents increased 5.3%, rising from $3,176 in Q1 2025 to $3,345 in Q1 2026.
The table below shows year-over-year data by unit type for Q1 2025 and Q1 2026, focused on studios through 2 bedrooms only.
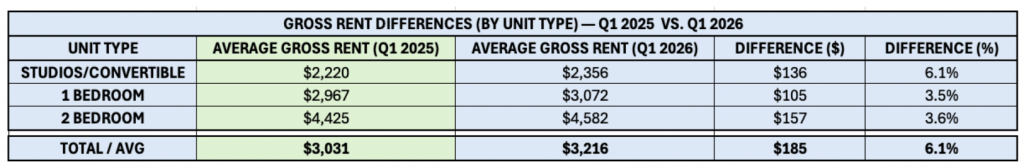
The total average and studio growth rates both landing at 6.1% is not a coincidence. As 2-bedroom leasing increased from 19% to 22% of the mix, their higher price point pushed the overall average higher, bringing total growth in line with studio growth even though the factors behind each are different.
Across all three unit types, average square footage remained essentially flat year-over-year, indicating that rent growth was driven by pricing rather than unit size. Within each unit type, premium properties at the higher end of the market influenced the averages, particularly in 1 bedrooms and 2 bedrooms.
At 6.1%, studios posted the strongest rent growth of any unit type, driven in part by lower inventory relative to Q1 2025. Average SF remained flat year-over-year, reinforcing that pricing is driving the increase. With fewer units available in Q1 2026, the data points to demand outpacing supply, with income qualification also playing a role as renters face a widening gap between unit types.
1 bedrooms remained the dominant unit type at 49% of all leases, with rents increasing 3.5% to an average of $3,072 in Q1 2026. Average SF declined slightly from 744 to 741, resulting in PPSF growth of 4.0%, slightly above the 3.5% increase in gross rent.
Average 2-bedroom rents increased 3.6% to $4,582 in Q1 2026, while their share of total leases rose from 19% to 22%. Average SF remained unchanged at 1,151, making 2 bedrooms the cleanest view in the dataset, with gross rent and PPSF both increasing 3.6%.
Looking Ahead:
Q2 is historically the strongest leasing quarter in Chicago’s Class A market, and the seasonal increase in volume is significant. With supply remaining constrained and rent growth establishing a strong baseline in Q1, conditions heading into spring support continued rent growth. The question for operators is how hard to push. That decision will depend on whether the priority is maintaining occupancy or maximizing rent growth, though in a market this constrained, it may be possible to achieve both.
Q1 2026 reinforces a consistent theme that has developed over the past year, with pricing continuing to rise in a supply-constrained market even as leasing volume declines. The reduction in activity is not a demand problem, but the result of fewer lease-ups and limited available inventory.
At the same time, shifts in unit mix and renter behavior are shaping how that growth appears. Larger units are influencing overall rents, while value-driven demand is driving activity in submarkets where the pricing gap is clear.
Across all submarkets, PPSF growth confirms that pricing strength is real and not solely the result of larger units being leased. As the market enters peak leasing season, the combination of constrained supply, stable demand, and continued pricing power gives operators a clear runway. The question is how far to push.
At Luxury Living, we not only provide data, but analyze the data to help inform developers and capital partners to make the best decisions on pricing strategy, unit mix, and amenity programming.
Click Here to Download our Q1 2026 Chicago Class A Multifamily Market Update
Luxury Living is here to help you in all aspects of multifamily development. From pre-development consulting to marketing and leasing, we are Chicago’s multifamily leasing expert.